Johnson_DOX_24_3
Omar Johnson
2024-07-18
Last updated: 2024-07-23
Checks: 7 0
Knit directory: DOX_24_Github/
This reproducible R Markdown analysis was created with workflowr (version 1.7.1). The Checks tab describes the reproducibility checks that were applied when the results were created. The Past versions tab lists the development history.
Great! Since the R Markdown file has been committed to the Git repository, you know the exact version of the code that produced these results.
Great job! The global environment was empty. Objects defined in the global environment can affect the analysis in your R Markdown file in unknown ways. For reproduciblity it’s best to always run the code in an empty environment.
The command set.seed(20240723) was run prior to running
the code in the R Markdown file. Setting a seed ensures that any results
that rely on randomness, e.g. subsampling or permutations, are
reproducible.
Great job! Recording the operating system, R version, and package versions is critical for reproducibility.
Nice! There were no cached chunks for this analysis, so you can be confident that you successfully produced the results during this run.
Great job! Using relative paths to the files within your workflowr project makes it easier to run your code on other machines.
Great! You are using Git for version control. Tracking code development and connecting the code version to the results is critical for reproducibility.
The results in this page were generated with repository version 88c6686. See the Past versions tab to see a history of the changes made to the R Markdown and HTML files.
Note that you need to be careful to ensure that all relevant files for
the analysis have been committed to Git prior to generating the results
(you can use wflow_publish or
wflow_git_commit). workflowr only checks the R Markdown
file, but you know if there are other scripts or data files that it
depends on. Below is the status of the Git repository when the results
were generated:
Ignored files:
    Ignored:    .DS_Store
    Ignored:    analysis/Johnson_DOX_24_3.html
    Ignored:    analysis/Johnson_DOX_24_4.html
    Ignored:    analysis/Johnson_DOX_24_5.html
    Ignored:    analysis/Johnson_DOX_24_6.html
    Ignored:    analysis/Johnson_DOX_24_7.html
    Ignored:    analysis/Johnson_DOX_24_8.html
    Ignored:    analysis/Johnson_DOX_24_RUV_Limma.html

Untracked files:
    Untracked:  Fig_2.Rmd
    Untracked:  Fig_2.html
    Untracked:  analysis/Johnson_DOX_24_RUV_Limma.Rmd
Note that any generated files, e.g. HTML, png, CSS, etc., are not included in this status report because it is ok for generated content to have uncommitted changes.
These are the previous versions of the repository in which changes were
made to the R Markdown (analysis/Johnson_DOX_24_3.Rmd) and
HTML (docs/Johnson_DOX_24_3.html) files. If you’ve
configured a remote Git repository (see ?wflow_git_remote),
click on the hyperlinks in the table below to view the files as they
were in that past version.
| File | Version | Author | Date | Message |
|---|---|---|---|---|
| Rmd | 88c6686 | Omar-Johnson | 2024-07-23 | Publish the initial files for myproject |
Load Libraries
Read in Data
Functions
# 1
perform_module_comparisons_mutexc <- function(df, module_col, value_col) {
  # Ensure the necessary columns exist
  if (!(module_col %in% names(df) && value_col %in% names(df))) {
    stop("Specified columns do not exist in the dataframe.")
  }

  # Get a list of all unique modules
  modules <- unique(df[[module_col]])

  # Initialize an empty dataframe to store results
  results <- data.frame(Module1 = character(),
                        Module2 = character(),
                        WilcoxPValue = numeric(),
                        stringsAsFactors = FALSE)

  # Loop through each module
  for (module in modules) {
    # Data for the current module
    current_data <- df %>% filter(!!sym(module_col) == module) %>% pull(!!sym(value_col))

    # Data for all other modules
    other_data <- df %>% filter(!!sym(module_col) != module) %>% pull(!!sym(value_col))

    # Perform the Wilcoxon test
    test_result <- wilcox.test(current_data, other_data)

    # Add the results to the dataframe
    results <- rbind(results, data.frame(Module1 = module,
                                         Module2 = "Others",
                                         WilcoxPValue = test_result$p.value))
  }

  return(results)
}


# 2
perform_module_comparisons_mutexc_2 <- function(df, module_col, value_col) {
  # Ensure the necessary columns exist
  if (!(module_col %in% names(df) && value_col %in% names(df))) {
    stop("Specified columns do not exist in the dataframe.")
  }

  # Get a list of all unique modules
  modules <- unique(df[[module_col]])

  # Initialize an empty list to store combined data frames
  combined_df_list <- list()

  # Initialize an empty dataframe to store results
  results <- data.frame(Module1 = character(),
                        Module2 = character(),
                        WilcoxPValue = numeric(),
                        stringsAsFactors = FALSE)

  # Loop through each module
  for (module in modules) {
    # Data for the current module
    current_data <- df %>% filter(!!sym(module_col) == module) %>%
                    mutate(Group = as.character(module))

    # Data for all other modules
    other_data <- df %>% filter(!!sym(module_col) != module) %>%
                    mutate(Group = paste("Not", module, sep=""))

    # Combine current module data with other module data
    combined_data <- rbind(current_data, other_data)

    # Add the combined data to the list
    combined_df_list[[module]] <- combined_data

    # Perform the Wilcoxon test
    test_result <- wilcox.test(current_data[[value_col]], other_data[[value_col]])

    # Add the results to the dataframe
    results <- rbind(results, data.frame(Module1 = module,
                                         Module2 = "Others",
                                         WilcoxPValue = test_result$p.value))
  }

  return(list("results" = results, "combined_data" = combined_df_list))
}


# 3
# Generate enrichment function limited to the EXPRESSED proteins.
perform_module_disease_analysis_2 <- function(toptable, diseaseGenes) {
  # Prepare an empty list to collect results
  results <- list()

  # Ensure 'Modules' and 'Protein' columns exist in 'toptable'
  if(!"Modules" %in% names(toptable)) {
    stop("Column 'Modules' not found in the 'toptable'.")
  }
  if(!"Protein" %in% names(toptable)) {
    stop("Column 'Protein' not found in the 'toptable'.")
  }

  # Filter disease genes to include only those that are expressed in toptable
  expressedDiseaseGenes <- lapply(diseaseGenes, function(genes) {
    intersect(genes, toptable$Protein)
  })

  # Loop through each module
  modules <- unique(toptable$Modules)
  for (module in modules) {
    # Get the proteins in the module
    moduleGenes <- toptable$Protein[toptable$Modules == module]

    # Loop through each disease gene set
    for (diseaseName in names(expressedDiseaseGenes)) {
      # Find the intersecting genes between the module and the expressed disease genes
      diseaseModuleIntersect <- intersect(moduleGenes, expressedDiseaseGenes[[diseaseName]])

      # Calculate elements for the contingency table
      numIntersect = length(diseaseModuleIntersect)
      numInModuleNotDisease = length(moduleGenes) - numIntersect
      numInDiseaseNotModule = length(expressedDiseaseGenes[[diseaseName]]) - numIntersect
      numInNeither = nrow(toptable) - (numIntersect + numInModuleNotDisease + numInDiseaseNotModule)

      # Build the contingency table
      table <- matrix(c(
        numIntersect, # Both in disease list and module
        numInModuleNotDisease, # In module but not disease list
        numInDiseaseNotModule, # In disease list but not module
        numInNeither # In neither list
      ), nrow = 2, byrow = TRUE)

      # Perform chi-squared test and Fisher's exact test with error handling
      chiSqTestResult <- tryCatch({
        chisq.test(table, correct = TRUE)
      }, error = function(e) {
        list(p.value = NA)
      }, warning = function(w) {
        list(p.value = NA)
      })

      fisherTestResult <- tryCatch({
        fisher.test(table)
      }, error = function(e) {
        list(p.value = NA, odds.ratio = NA)
      }, warning = function(w) {
        list(p.value = NA, odds.ratio = NA)
      })

      # Calculate percent overlap, handle division by zero
      percentOverlap <- if (length(moduleGenes) > 0) {
        (numIntersect / length(expressedDiseaseGenes[[diseaseName]])) * 100
      } else {
        0
      }

      # Convert intersecting genes to a single character string
      intersectingGenesStr <- if (numIntersect > 0) {
        paste(diseaseModuleIntersect, collapse = ";")
      } else {
        ""  # Use an empty string to indicate no intersection
      }

      # Append to results list
      results[[paste(module, diseaseName, sep = "_")]] <- data.frame(
        Modules = module,
        Disease = diseaseName,
        ChiSqPValue = chiSqTestResult$p.value,
        FisherPValue = fisherTestResult$p.value,
        OddsRatio = fisherTestResult$estimate,
        PercentOverlap = percentOverlap,
        IntersectingGenes = intersectingGenesStr
      )
    }
  }

  # Combine results into a single data frame
  combined_df <- do.call(rbind, results)
  return(combined_df)
}


# 4
# For testing for enrichment in the circos plot
perform_module_disease_analysis <- function(toptable, diseaseGenes) {
  # Prepare an empty list to collect results
  results <- list()

  # Ensure 'Modules' and 'Protein' columns exist in 'toptable'
  if(!"Modules" %in% names(toptable)) {
    stop("Column 'Modules' not found in the 'toptable'.")
  }
  if(!"Protein" %in% names(toptable)) {
    stop("Column 'Protein' not found in the 'toptable'.")
  }

  # Filter disease genes to include only those that are expressed in toptable
  expressedDiseaseGenes <- lapply(diseaseGenes, function(genes) {
    intersect(genes, toptable$Protein)
  })

  # Loop through each module
  modules <- unique(toptable$Modules)
  for (module in modules) {
    # Get the genes in the module
    moduleGenes <- toptable$Protein[toptable$Modules == module]

    # Loop through each disease gene set
    for (diseaseName in names(expressedDiseaseGenes)) {
      # Find the intersecting genes between the module and the expressed disease genes
      diseaseModuleIntersect <- intersect(moduleGenes, expressedDiseaseGenes[[diseaseName]])

      # Calculate elements for the contingency table
      numIntersect = length(diseaseModuleIntersect)
      numInModuleNotDisease = length(moduleGenes) - numIntersect
      numInDiseaseNotModule = length(expressedDiseaseGenes[[diseaseName]]) - numIntersect
      numInNeither = nrow(toptable) - (numIntersect + numInModuleNotDisease + numInDiseaseNotModule)

      # Build the contingency table
      table <- matrix(c(
        numIntersect, # Both in disease list and module
        numInModuleNotDisease, # In module but not disease list
        numInDiseaseNotModule, # In disease list but not module
        numInNeither # In neither list
      ), nrow = 2, byrow = TRUE)

      # Perform chi-squared test and Fisher's exact test with error handling
      chiSqTestResult <- tryCatch({
        chisq.test(table, correct = TRUE)
      }, error = function(e) {
        list(p.value = NA)
      }, warning = function(w) {
        list(p.value = NA)
      })

      fisherTestResult <- tryCatch({
        fisher.test(table)
      }, error = function(e) {
        list(p.value = NA)
      }, warning = function(w) {
        list(p.value = NA)
      })

      # Calculate percent overlap, handle division by zero
      percentOverlap <- if (length(moduleGenes) > 0) {
        (numIntersect / length(expressedDiseaseGenes[[diseaseName]])) * 100
      } else {
        0
      }

      # Convert intersecting genes to a single character string
      intersectingGenesStr <- if (numIntersect > 0) {
        paste(diseaseModuleIntersect, collapse = ";")
      } else {
        ""  # Use an empty string to indicate no intersection
      }

      # Append to results list
      results[[paste(module, diseaseName, sep = "_")]] <- data.frame(
        Modules = module,
        Disease = diseaseName,
        ChiSqPValue = chiSqTestResult$p.value,
        FisherPValue = fisherTestResult$p.value,
        PercentOverlap = percentOverlap,
        IntersectingGenes = intersectingGenesStr
      )
    }
  }

  # Combine results into a single data frame
  results_df <- do.call(rbind, results)
  return(results_df)
}
Fig-3-A- Tissue spec module percentages
Tissue_spec %>% head() Gene Gene.synonym Ensembl
1 ANKRD1 ALRP, C-193, CARP, CVARP, MCARP ENSG00000148677
2 CASQ2 PDIB2 ENSG00000118729
3 CCDC141 CAMDI, FLJ39502 ENSG00000163492
4 CORIN ATC2, CRN, Lrp4, PRSC, TMPRSS10 ENSG00000145244
5 CRIP2 CRP2, ESP1 ENSG00000182809
6 FITM2 C20orf142, dJ881L22.2, FIT2 ENSG00000197296
Gene.description Uniprot HPA_Class
1 Ankyrin repeat domain 1 Q15327 Tissue_enriched
2 Calsequestrin 2 O14958 Tissue_enriched
3 Coiled-coil domain containing 141 Q6ZP82 Tissue_enriched
4 Corin, serine peptidase Q9Y5Q5 Tissue_enriched
5 Cysteine rich protein 2 P52943 Tissue_enriched
6 Fat storage inducing transmembrane protein 2 Q8N6M3 Tissue_enriched
Specificity
1 1
2 1
3 1
4 1
5 1
6 1# Specificity ranges 0-4, where 0 is most specific and 4 is most specific, a way I notated the classes for easier subsetting.
Tissue_spec_Elevated <- Tissue_spec[Tissue_spec$Specificity >= 0 , ]$Uniprot
Heart_Elevated_TT <- Toptable_Modules[Toptable_Modules$Proteins %in% Tissue_spec_Elevated, ]
Heart_Elevated_TT %>% head() X Proteins kTotal kWithin kOut kDiff logFC.x AveExpr.x
17 17 A5D6W6 52.299742 24.798855 27.500887 -2.702032 -0.02774699 19.11923
28 28 A7E2Y1 5.274765 1.274155 4.000610 -2.726454 0.13279329 20.68953
33 33 B0YJ81 20.706246 16.929355 3.776891 13.152464 0.15285034 20.81051
34 34 B2RUZ4 9.743957 2.619998 7.123959 -4.503962 0.21622333 19.20732
106 106 O14531 64.372981 49.985280 14.387701 35.597579 0.62386638 17.88547
109 109 O14561 4.128437 1.009408 3.119029 -2.109620 0.40391201 17.29644
t.x P.Value.x adj.P.Val.x B.x threshold_P.x Modules.x
17 -0.2829644 0.786442392 0.786442392 -6.8797598 FALSE salmon
28 0.9152931 0.394702310 0.394702310 -6.4733724 FALSE darkred
33 2.1697133 0.071764703 0.071764703 -4.9182098 FALSE royalblue
34 1.0318591 0.341215957 0.341215957 -6.3603407 FALSE midnightblue
106 5.7412437 0.001094762 0.001094762 -0.4750144 TRUE darkgreen
109 1.5066709 0.181704062 0.181704062 -5.8148770 FALSE brown
DE_or_Not.x Norm_kIN Norm_kOut logFC.y AveExpr.y t.y
17 FALSE 0.119225266 0.0069271755 -0.02774699 19.11923 -0.2829644
28 FALSE 0.001596686 0.0011836123 0.13279329 20.68953 0.9152931
33 FALSE 0.023677419 0.0010906413 0.15285034 20.81051 2.1697133
34 FALSE 0.011244625 0.0018058199 0.21622333 19.20732 1.0318591
106 TRUE 0.089259428 0.0039767001 0.62386638 17.88547 5.7412437
109 FALSE 0.020600170 0.0007553956 0.40391201 17.29644 1.5066709
P.Value.y adj.P.Val.y B.y threshold_P.y Modules.y DE_or_Not.y
17 0.786442392 0.786442392 -6.8797598 FALSE salmon FALSE
28 0.394702310 0.394702310 -6.4733724 FALSE darkred FALSE
33 0.071764703 0.071764703 -4.9182098 FALSE royalblue FALSE
34 0.341215957 0.341215957 -6.3603407 FALSE midnightblue FALSE
106 0.001094762 0.001094762 -0.4750144 TRUE darkgreen TRUE
109 0.181704062 0.181704062 -5.8148770 FALSE brown FALSE
Is_DA Is_DOXcorrelated Is_Hub Is_Cis_pQTL Is_Trans_pQTL Is_pQTL
17 0 1 0 0 0 0
28 0 0 0 0 0 0
33 0 0 0 0 0 0
34 0 1 0 0 0 0
106 1 1 0 0 0 0
109 0 0 0 0 0 0
pLI_assigned pLI_Mut.Intolerant pLI_Mut.Tolerant Is_Druggable
17 1 0 1 0
28 0 0 0 0
33 0 0 0 0
34 1 0 1 0
106 1 0 1 0
109 1 0 0 0
Is_CVD_protein Is_CVD_PPI_protein
17 0 0
28 0 0
33 0 1
34 0 0
106 0 0
109 0 0Heart_Elevated_TT$Modules.x %>% unique() [1] "salmon" "darkred" "royalblue" "midnightblue" "darkgreen"
[6] "brown" "lightyellow" "grey" "green" "lightgreen"
[11] "blue" "magenta" # Summarize the count of each module in Toptable_Modules
module_counts_toptable <- Toptable_Modules %>%
group_by(Modules.x) %>%
summarize(Count = n())
# Summarize the count of each module in Heart_Elevated_TT
module_counts_heart_elevated <- Heart_Elevated_TT %>%
group_by(Modules.x) %>%
summarize(Count = n())
# Calculate the percentage for each module in Heart_Elevated_TT
heart_elevated_summary <- module_counts_heart_elevated %>%
left_join(module_counts_toptable, by = "Modules.x", suffix = c("_Heart", "_Toptable")) %>%
mutate(Percentage = (Count_Heart / Count_Toptable) * 100)
heart_elevated_summary# A tibble: 12 × 4
Modules.x Count_Heart Count_Toptable Percentage
<chr> <int> <int> <dbl>
1 blue 2 45 4.44
2 brown 1 49 2.04
3 darkgreen 27 560 4.82
4 darkred 35 798 4.39
5 green 21 579 3.63
6 grey 5 106 4.72
7 lightgreen 13 262 4.96
8 lightyellow 13 437 2.97
9 magenta 10 129 7.75
10 midnightblue 11 233 4.72
11 royalblue 33 715 4.62
12 salmon 9 208 4.33yellowDF <- data.frame(
Modules.x = "yellow",
Count_Heart = 0,
Count_Toptable = 0,
Percentage = 0
)
heart_elevated_summary_yellow <- rbind(heart_elevated_summary,yellowDF)
module_order <- c("green","darkgreen","midnightblue","salmon","lightyellow", "lightgreen","blue", "magenta","darkred", "brown", "yellow", "royalblue", "grey")
heart_elevated_summary_2 <- heart_elevated_summary_yellow
# Factor the Module column in Fulltrait_df
heart_elevated_summary_2$Modules.x <- factor(heart_elevated_summary_2$Modules.x, levels = module_order)
# Plotting the percentages
ggplot(data = heart_elevated_summary_2, mapping = aes(x = Modules.x, y = Percentage, fill = Modules.x)) +
geom_col() +
scale_fill_identity() +
theme_classic() +
theme(axis.text.x = element_text(angle = 45, hjust = 1)) +
labs(title = "",
x = "",
y = "Percentage of heart elevated proteins within each module") +
scale_fill_identity()+
ylim(c(0,10))+
geom_hline(yintercept = 4.444, color = "red", linetype = "dashed", linewidth = 0.8)Scale for fill is already present.
Adding another scale for fill, which will replace the existing scale.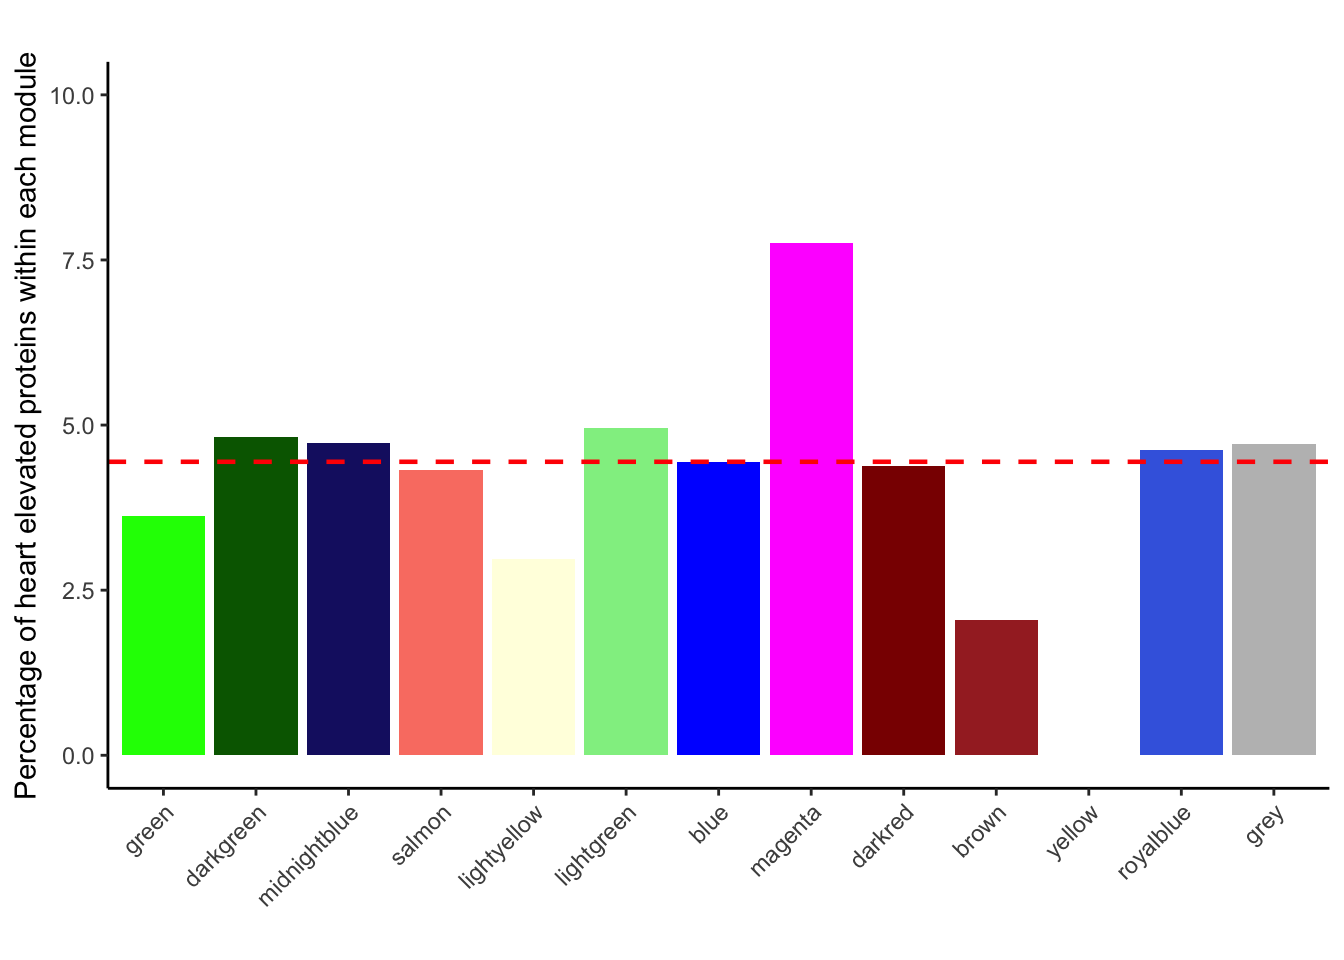
heart_elevated_summary_2$Percentage %>% range()[1] 0.000000 7.751938heart_elevated_summary_2$Percentage %>% median()[1] 4.444444Fig-3-B &. S8 Tissue specificity scores
# Wrangle
Tissue_spec_merge <- merge(Tissue_spec_2, Toptable_Modules, by.x = "Uniprot", by.y = "Proteins")

Tissue_spec_merge$Heart.Ventricle <- Tissue_spec_merge$Heart.Ventricle %>% as.double()
Warning in Tissue_spec_merge$Heart.Ventricle %>% as.double(): NAs introduced by
coercionTissue_spec_merge_2 <- Tissue_spec_merge
# Example usage
# Replace "Modules" with the actual column name of your modules
# Replace "Heart.Ventricle" with the actual column name of your values
Tissue_spec_merge$Heart.Ventricle <- as.double(Tissue_spec_merge$Heart.Ventricle)
results_df_HV <- perform_module_comparisons_mutexc(Tissue_spec_merge, "Modules.x", "Heart.Ventricle")
results_df_HV[results_df_HV$WilcoxPValue < 0.05, ] Module1 Module2 WilcoxPValue
1 darkred Others 1.411025e-08
7 salmon Others 2.526116e-10
8 green Others 1.815933e-41
9 darkgreen Others 4.697999e-03
10 midnightblue Others 1.037008e-03
12 brown Others 1.743286e-03#### With mutually exclusive sets and plotting ####
# Example usage
# Replace "Modules" with the actual column name of your modules
# Replace "Heart.Ventricle" with the actual column name of your values
results_df_HV <- perform_module_comparisons_mutexc_2(Tissue_spec_merge, "Modules.x", "Heart.Ventricle")
results_df_HV$results[results_df_HV$results$WilcoxPValue<0.05, ] Module1 Module2 WilcoxPValue
1 darkred Others 1.411025e-08
7 salmon Others 2.526116e-10
8 green Others 1.815933e-41
9 darkgreen Others 4.697999e-03
10 midnightblue Others 1.037008e-03
12 brown Others 1.743286e-03results_df_HV_combined <- do.call(rbind, results_df_HV$combined_data)
results_df_HV_combined$Group %>% unique() [1] "darkred" "Notdarkred" "royalblue" "Notroyalblue"
[5] "lightgreen" "Notlightgreen" "lightyellow" "Notlightyellow"
[9] "magenta" "Notmagenta" "grey" "Notgrey"
[13] "salmon" "Notsalmon" "green" "Notgreen"
[17] "darkgreen" "Notdarkgreen" "midnightblue" "Notmidnightblue"
[21] "blue" "Notblue" "brown" "Notbrown"
[25] "yellow" "Notyellow" Group_order <- c("green", "Notgreen","darkgreen", "Notdarkgreen", "midnightblue","Notmidnightblue", "salmon","Notsalmon", "lightyellow", "Notlightyellow", "lightgreen", "Notlightgreen","blue", "Notblue", "magenta" ,"Notmagenta","darkred", "Notdarkred", "brown", "Notbrown", "yellow", "Notyellow","royalblue", "Notroyalblue", "grey", "Notgrey" )
# Factor the Module column in Fulltrait_df
results_df_HV_combined$Group <- factor(results_df_HV_combined$Group, levels = Group_order)
my_colors <- c("green", "green","darkgreen", "darkgreen", "midnightblue","midnightblue", "salmon","salmon", "lightyellow", "lightyellow", "lightgreen", "lightgreen","blue", "blue", "magenta" ,"magenta","darkred", "darkred", "brown", "brown", "yellow", "yellow","royalblue", "royalblue", "grey", "grey")
ggplot(results_df_HV_combined, aes(x = Group, y = Heart.Ventricle, fill = Group)) +
geom_boxplot() +
scale_fill_manual(values = my_colors) + # Manually setting the colors
theme_classic() +
theme(axis.text.x = element_text(angle = 45, hjust = 1),
legend.position = "none") + # Removing the legend
labs(title = "Ventricle tissue specificity scores of proteins",
x = "",
y = "TS score ") +
coord_cartesian(
ylim = c(-5,5)
)+ geom_hline(yintercept = 0.33, color = "red", linetype = "dashed", linewidth = 0.6) Warning: Removed 2821 rows containing non-finite values (`stat_boxplot()`).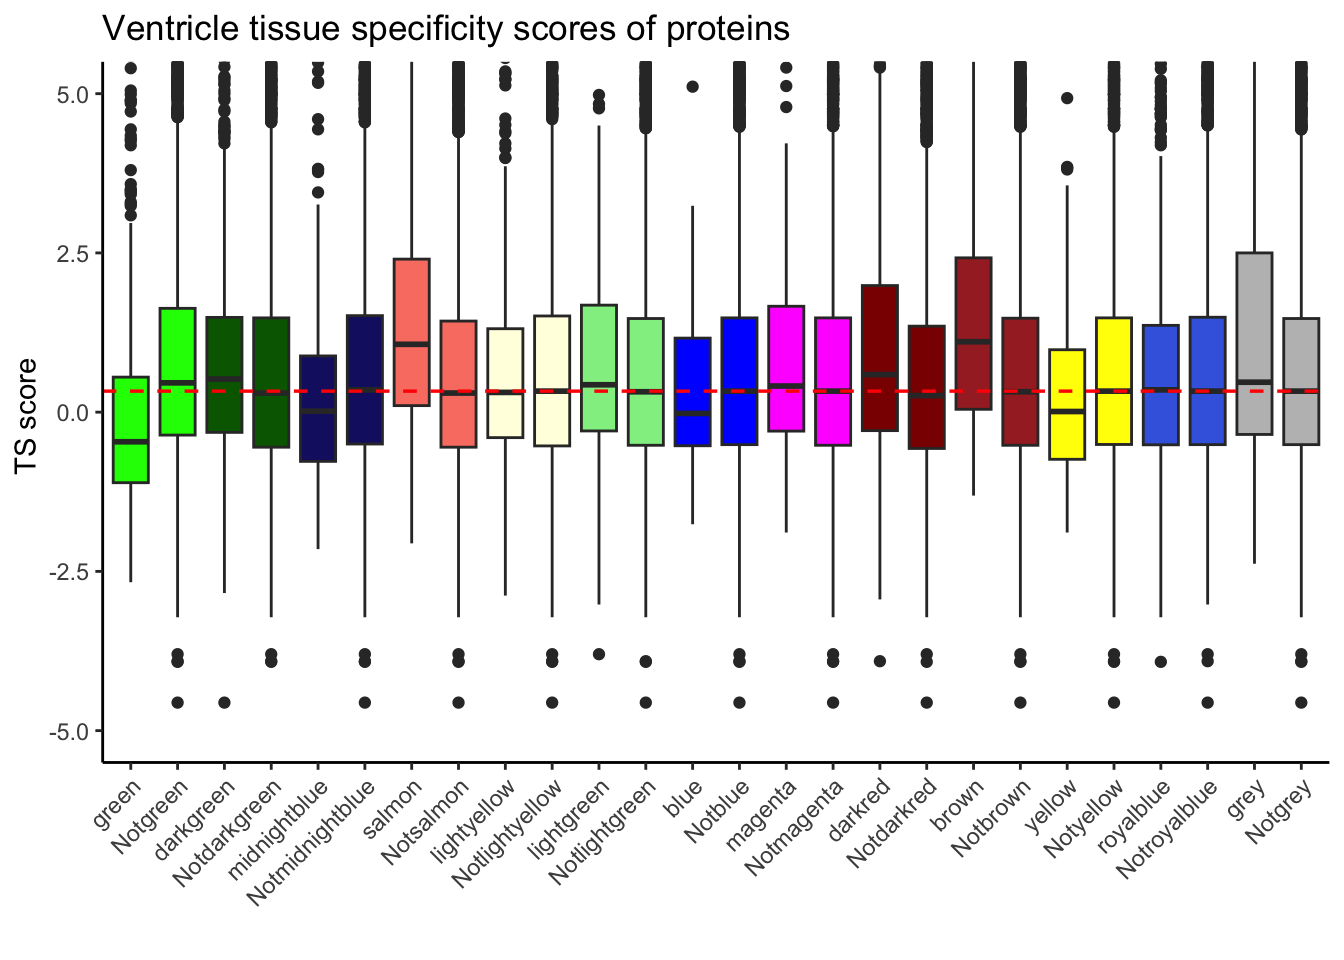
#### Tissue spec DA vs ~ DA ####
Tissue_spec_merge_DA <- Tissue_spec_merge[Tissue_spec_merge$P.Value.x < 0.05, ]

Tissue_spec_merge_NotDA <- Tissue_spec_merge[Tissue_spec_merge$P.Value.x > 0.05, ]


wilcox.test(Tissue_spec_merge_DA$Heart.Ventricle,Tissue_spec_merge_NotDA$Heart.Ventricle )
    Wilcoxon rank sum test with continuity correction

data:  Tissue_spec_merge_DA$Heart.Ventricle and Tissue_spec_merge_NotDA$Heart.Ventricle
W = 1266626, p-value < 2.2e-16
alternative hypothesis: true location shift is not equal to 0
ggplot(Tissue_spec_merge, aes(x = DE_or_Not.x, y = Heart.Ventricle, fill = DE_or_Not.x)) +
geom_boxplot() +
scale_x_discrete(labels = c("Non-DA", "DA")) + # Manually setting group names
theme_minimal() +
theme(axis.text.x = element_text(angle = 45, hjust = 1),
legend.position = "none") + # Removing the legend
labs(title = "Ventricle tissue specificity scores of proteins",
x = "",
y = "Heart ventricle TS score") +
coord_cartesian(ylim = c(-2.5,2.5))Warning: Removed 217 rows containing non-finite values (`stat_boxplot()`).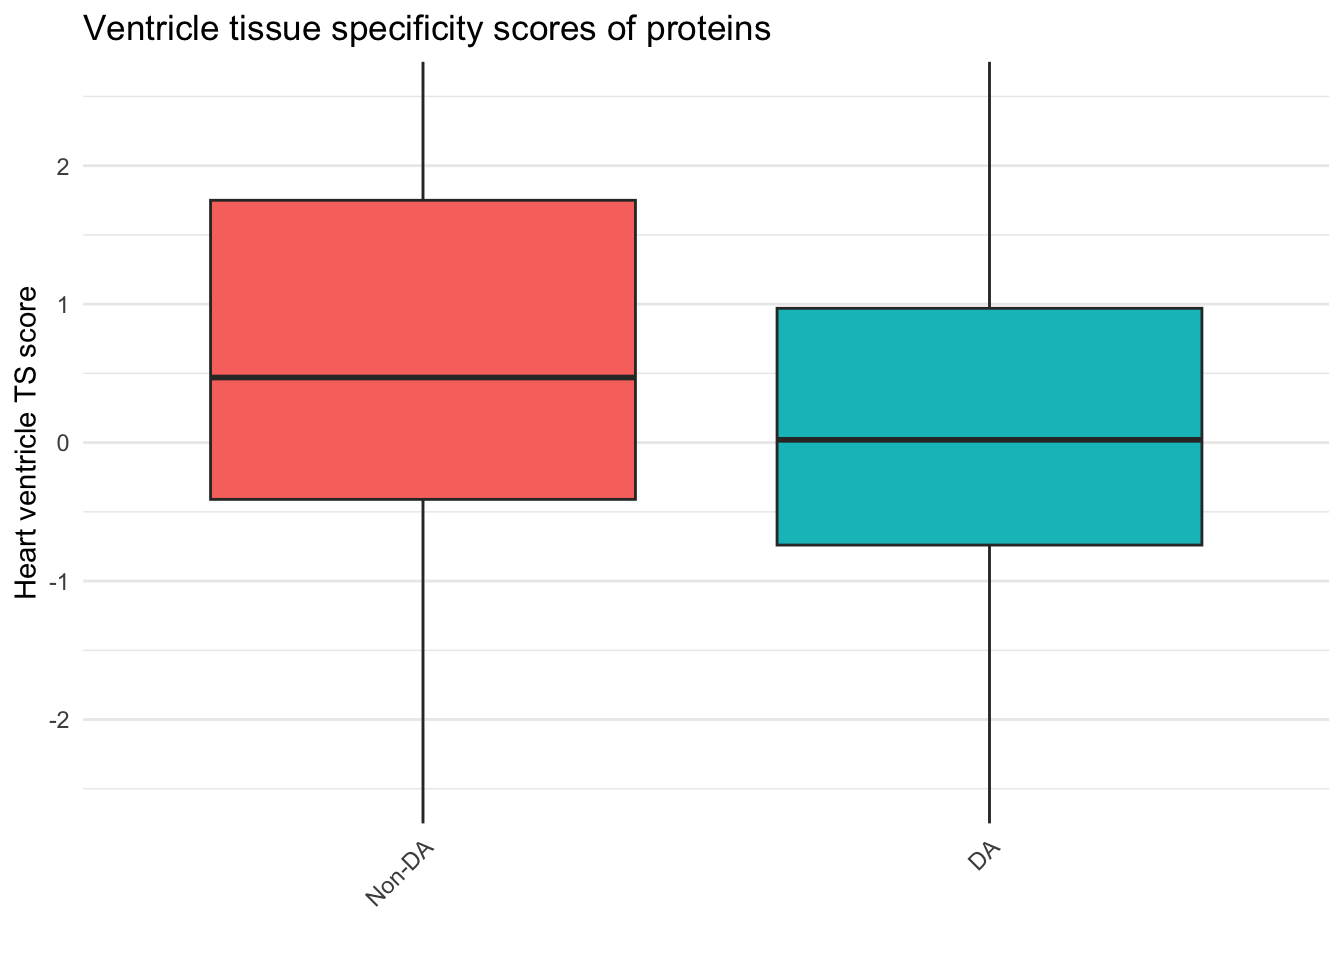
Fig-3-C Heatmap for broad locations
Toptable_Modules %>% colnames() [1] "X" "Proteins" "kTotal"
[4] "kWithin" "kOut" "kDiff"
[7] "logFC.x" "AveExpr.x" "t.x"
[10] "P.Value.x" "adj.P.Val.x" "B.x"
[13] "threshold_P.x" "Modules.x" "DE_or_Not.x"
[16] "Norm_kIN" "Norm_kOut" "logFC.y"
[19] "AveExpr.y" "t.y" "P.Value.y"
[22] "adj.P.Val.y" "B.y" "threshold_P.y"
[25] "Modules.y" "DE_or_Not.y" "Is_DA"
[28] "Is_DOXcorrelated" "Is_Hub" "Is_Cis_pQTL"
[31] "Is_Trans_pQTL" "Is_pQTL" "pLI_assigned"
[34] "pLI_Mut.Intolerant" "pLI_Mut.Tolerant" "Is_Druggable"
[37] "Is_CVD_protein" "Is_CVD_PPI_protein"colnames(Toptable_Modules) <- c("X", "Protein","kTotal", "kWithin", "kOut", "kDiff", "logFC", "AveExpr", "t", "P.Value","adj.P.Val" ,"B" , "threshold_P", "Modules", "DE_or_Not", "Norm_kIN", "Norm_kOut", "logFC.y", "AveExpr.y", "t.y", "P.Value.y", "adj.P.Val.y", "B.y" , "threshold_P.y", "Modules.y", "DE_or_Not.y", "Is_DA", "Is_DOXcorrelated", "Is_Hub", "Is_Cis_pQTL", "Is_Trans_pQTL", "Is_pQTL", "pLI_assigned", "pLI_Mut.Intolerant", "pLI_Mut.Tolerant", "Is_Druggable", "Is_CVD_protein", "Is_CVD_PPI_protein")
Toptable_Modules$Modules %>% unique() [1] "darkred" "royalblue" "green" "lightgreen" "lightyellow"
[6] "magenta" "grey" "salmon" "darkgreen" "midnightblue"
[11] "blue" "brown" "yellow" # Plot results
results_df <- perform_module_disease_analysis_2(toptable = Toptable_Modules, diseaseGenes = HPA_General)
results_df$Disease %>% unique() [1] "41586_2020_2077_MOESM4_ESM" "CD_Markers"
[3] "Druggable_proteins" "GPCRs"
[5] "Intracellular" "membrane_and_secreted"
[7] "Membrane" "MSG"
[9] "Plasma" "RBP_41586_2020_2077_MOESM3_ESM"
[11] "Secreted" "Signal_peptide"
[13] "Transcription_Factor_1_s2" "Transcription_factors"
[15] "Transporters" "Voltage_gated_channels" results_df_2 <- results_df[results_df$Disease %in% c("Intracellular", "Membrane","Plasma","Secreted"), ]
results_df_2[(results_df_2$FisherPValue < 0.05) & (results_df_2$OddsRatio > 1),c(1:5)] Modules Disease ChiSqPValue FisherPValue
royalblue_Membrane royalblue Membrane 1.659116e-13 7.167432e-13
royalblue_Secreted royalblue Secreted 5.449211e-06 2.116904e-05
green_Intracellular green Intracellular 7.632923e-08 2.818731e-08
salmon_Intracellular salmon Intracellular 1.233500e-02 9.301020e-03
darkgreen_Intracellular darkgreen Intracellular 1.168793e-02 1.108015e-02
darkgreen_Plasma darkgreen Plasma 1.671042e-07 1.908351e-07
midnightblue_Membrane midnightblue Membrane 3.095355e-02 3.183487e-02
blue_Membrane blue Membrane 2.941408e-04 4.612730e-04
yellow_Membrane yellow Membrane 2.356325e-02 2.213791e-02
OddsRatio
royalblue_Membrane 1.892681
royalblue_Secreted 2.271911
green_Intracellular 1.771155
salmon_Intracellular 1.533238
darkgreen_Intracellular 1.297732
darkgreen_Plasma 1.614798
midnightblue_Membrane 1.378914
blue_Membrane 2.961655
yellow_Membrane 1.909330melted_results <- melt(results_df_2, id.vars = c("Modules", "Disease", "PercentOverlap", "FisherPValue","OddsRatio" ))
# First, create a new column that indicates where to place stars
melted_results$Star <- ifelse(melted_results$FisherPValue < 0.05 & melted_results$OddsRatio > 1, "*", "")
module_order <- c("green","darkgreen","midnightblue","salmon","lightyellow", "lightgreen","blue", "magenta","darkred", "brown", "yellow", "royalblue", "grey")
melted_results_2 <- melted_results
# Factor the Module column in Fulltrait_df
melted_results_2$Modules <- factor(melted_results_2$Modules, levels = module_order)
# Vertical
ggplot(melted_results_2, aes(x = Modules, y = Disease, fill = OddsRatio)) +
geom_tile(color = "black") +
scale_fill_gradientn(colors = c("blue", "white", "red"),
values = scales::rescale(c(0, 1, max(melted_results_2$OddsRatio))),
na.value = "grey50", name = "Odds ratio") +
geom_text(aes(label = Star), color = "black", size = 8, na.rm = TRUE) +
labs(x = "", y = "") +
theme_minimal() +
theme(
axis.text.x = element_text(angle = 90, vjust = 0.5, hjust = 1),
axis.text.y = element_text(hjust = 0.5),
axis.title = element_text(size = 12),
legend.key.size = unit(0.6, 'cm'),
legend.title = element_text(size = 10),
legend.text = element_text(size = 8)
)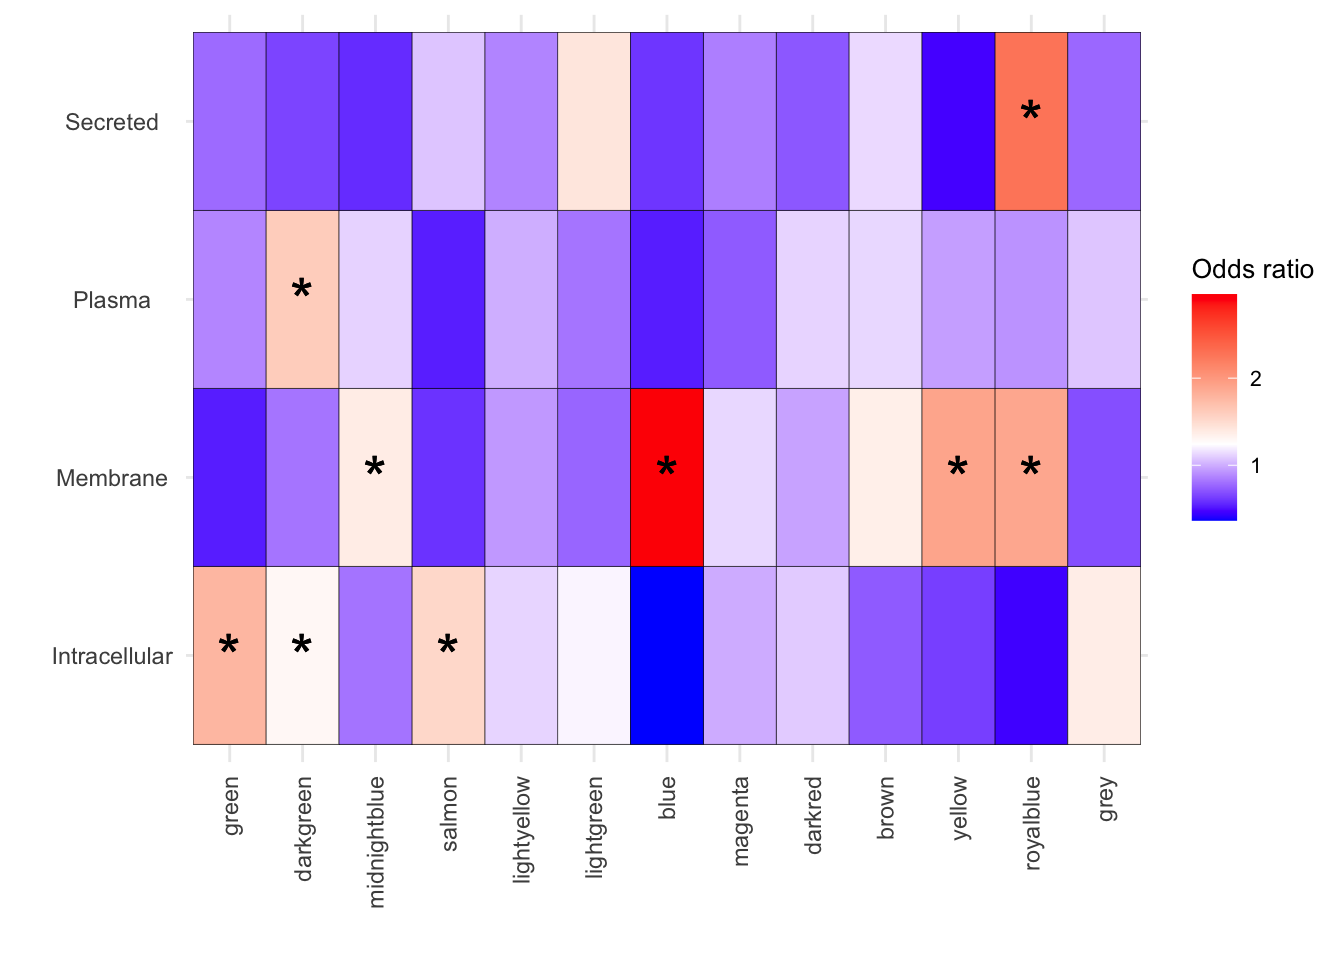
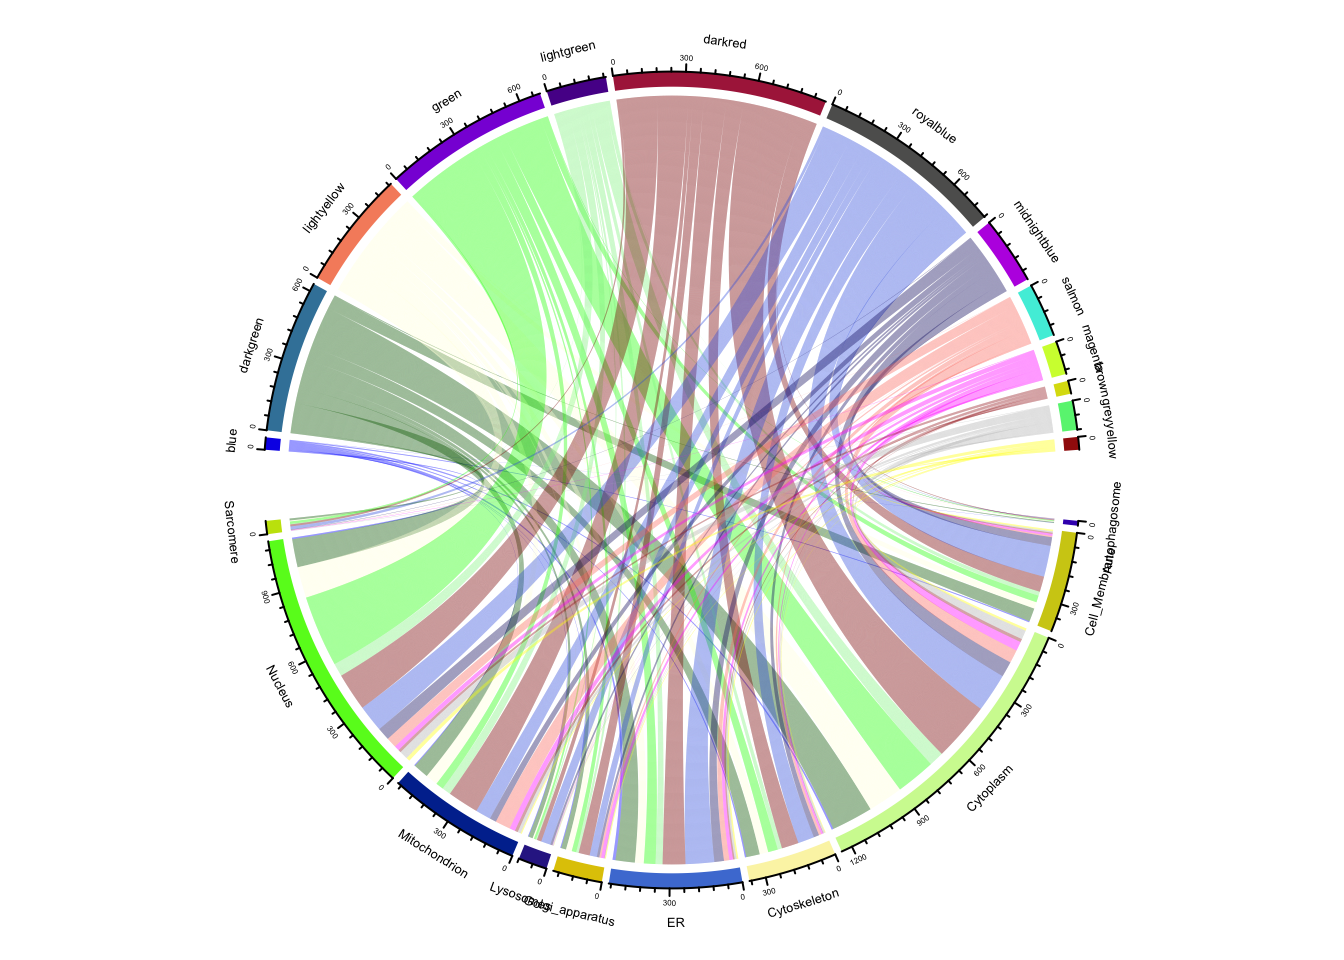
Fig-3-D Subcellular compartment distribution
# Assuming 'Toptable_Modules' is your data frame with proteins and their modules
Toptable_Modules_comp <- Toptable_Modules

# Create an empty data frame for edges
edges <- data.frame(from = character(), to = character())

list_of_compartments <- list(
  Autophagosome = Autophagosome_comp,
  Cell_Membrane = Cell_Membrane_comp,
  Cytoplasm = Cytoplasm_comp,
  Cytoskeleton = Cytoskeleton_comp,
  ER = ER_comp,
  Golgi_apparatus = Golgi_apparatus_comp,
  Lysosomes = Lysosomes_comp,
  Mitochondrion = Mitochondrion_comp,
  Nucleus = Nucleus_comp,
  Sarcomere = Sarcomere_comp
)

# List of proteins in each compartment
compartment_list <- list(
  Autophagosome = Autophagosome_comp,
  Cell_Membrane = Cell_Membrane_comp,
  Cytoplasm = Cytoplasm_comp,
  Cytoskeleton = Cytoskeleton_comp,
  ER = ER_comp,
  Golgi_apparatus = Golgi_apparatus_comp,
  Lysosomes = Lysosomes_comp,
  Mitochondrion = Mitochondrion_comp,
  Nucleus = Nucleus_comp,
  Sarcomere = Sarcomere_comp
)


# Loop through each compartment vector and add rows to the edges data frame
for(compartment_name in names(list_of_compartments)) {
  compartment <- list_of_compartments[[compartment_name]]
  for(protein in compartment) {
    module <- Toptable_Modules_comp$Modules[Toptable_Modules_comp$Protein == protein ]
    if(length(module) > 0) {
      edges <- rbind(edges, data.frame(from = module, to = compartment_name))
    }
  }
}


# Create Nodes data frame
unique_nodes <- unique(c(as.character(edges$from), as.character(edges$to)))
Nodes <- data.frame(name = unique_nodes)

# Modify edges to use indices
edges$from <- match(edges$from, Nodes$name) - 1  # -1 because JavaScript is zero-indexed

edges$to <- match(edges$to, Nodes$name) - 1

# Add a 'value' column to edges if not present
edges$value <- 1  # or any other appropriate value


module_df <- data.frame(
  protein = Toptable_Modules$Protein,
  module = as.character(Toptable_Modules$Modules)
)


# Create a color mapping for modules (replace with actual colors)
module_colors <- setNames((Toptable_Modules$Modules %>% unique()), (Toptable_Modules$Modules %>% unique()))


# Create a grid that combines compartments and modules
grid <- lapply(names(compartment_list), function(compartment) {
  proteins <- compartment_list[[compartment]]
  modules <- module_df$module[module_df$protein %in% proteins]
  c(setNames(rep(compartment, length(proteins)), proteins),
    setNames(modules, proteins))
})

# Flatten the grid list
grid <- unlist(grid)


# Prepare the color list for the grid
grid_colors <- sapply(names(grid), function(name) {
  if (name %in% module_df$protein) {
    module_colors[grid[name]]
  } else {
    "white"  # color for compartments
  }
})
grid <- grid %>% as.data.frame()


# Create links data frame
links <- do.call(rbind, lapply(names(compartment_list), function(compartment) {
  proteins <- compartment_list[[compartment]]
  modules <- module_df$module[module_df$protein %in% proteins]
  data.frame(from = compartment, to = modules)
}))


# Adjust the text size for sector labels and tick labels
circos.par("track.height" = 0.3, "points.overflow.warning" = FALSE)
par(cex = 0.5, mar = c(0, 0, 0, 0))

# Chord diagram plotting
chordDiagram(
  x = links,
  col = module_colors[links$to],
  transparency = 0.5
)
# Reset the default circos parameters after plotting
circos.clear()


# Results for statistical enrichment
results_df <- perform_module_disease_analysis(toptable = Toptable_Modules, diseaseGenes = compartment_list)


results_df[(results_df$FisherPValue < 0.05), ]$Modules %>% unique
[1] "darkred" "royalblue" "green" "lightyellow" "magenta"
[6] "salmon" "darkgreen" "midnightblue" "blue" "brown"
[11] "yellow" results_df <- results_df %>% as.tibble() Warning: `as.tibble()` was deprecated in tibble 2.0.0.
ℹ Please use `as_tibble()` instead.
ℹ The signature and semantics have changed, see `?as_tibble`.
This warning is displayed once every 8 hours.
Call `lifecycle::last_lifecycle_warnings()` to see where this warning was
generated.results_df[(results_df$FisherPValue < 0.05) & (results_df$Modules == "green"), ]# A tibble: 5 × 6
Modules Disease ChiSqPValue FisherPValue PercentOverlap IntersectingGenes
<chr> <chr> <dbl> <dbl> <dbl> <chr>
1 green Cell_Membra… 4.57e- 5 1.28e- 5 7.19 O60291;O60716;O7…
2 green ER 1.06e- 3 5.64e- 4 9.27 A5PLL7;O15155;O1…
3 green Lysosomes 5.59e- 2 4.33e- 2 7.5 O15118;P01130;Q0…
4 green Mitochondri… 1.87e- 8 9.23e-10 6.10 O00483;O15164;O1…
5 green Nucleus 7.42e-59 4.01e-53 28.2 O00267;O00291;O0…results_df[(results_df$FisherPValue < 0.05) & (results_df$Modules == "darkgreen"), ]# A tibble: 1 × 6
Modules Disease ChiSqPValue FisherPValue PercentOverlap IntersectingGenes
<chr> <chr> <dbl> <dbl> <dbl> <chr>
1 darkgreen Nucleus 0.0100 0.00881 11.1 O00165;O00442;O0062…results_df[(results_df$FisherPValue < 0.05) & (results_df$Modules == "midnightblue"), ]# A tibble: 2 × 6
Modules Disease ChiSqPValue FisherPValue PercentOverlap IntersectingGenes
<chr> <chr> <dbl> <dbl> <dbl> <chr>
1 midnightblue Cell_M… 0.00136 0.00217 9.11 B2RUZ4;O00443;O1…
2 midnightblue ER 0.0308 0.0281 7.64 O14523;O14656;O1…results_df[(results_df$FisherPValue < 0.05) & (results_df$Modules == "salmon"), ]# A tibble: 3 × 6
Modules Disease ChiSqPValue FisherPValue PercentOverlap IntersectingGenes
<chr> <chr> <dbl> <dbl> <dbl> <chr>
1 salmon Cell_Membra… 7.14e- 4 1.18e- 4 1.44 P55287;P62745;Q1…
2 salmon Lysosomes 5.67e- 2 3.02e- 2 0.833 P20336
3 salmon Mitochondri… 4.94e-16 4.28e-13 12.0 O15091;O60783;O7…results_df[(results_df$FisherPValue < 0.05) & (results_df$Modules == "lightyellow"), ]# A tibble: 5 × 6
Modules Disease ChiSqPValue FisherPValue PercentOverlap IntersectingGenes
<chr> <chr> <dbl> <dbl> <dbl> <chr>
1 lightyellow Cell_Me… 0.0173 0.0141 6.95 O00571;O14494;P0…
2 lightyellow Cytopla… 0.0104 0.0109 12.4 A5YKK6;O00139;O0…
3 lightyellow ER 0.00703 0.00447 7.09 A1L0T0;O00264;O1…
4 lightyellow Lysosom… 0.0670 0.0482 5 O60271;Q15043;Q5…
5 lightyellow Nucleus 0.0239 0.0223 12.3 O00148;O00571;O4…
sessionInfo()R version 4.2.0 (2022-04-22)
Platform: x86_64-apple-darwin17.0 (64-bit)
Running under: macOS Big Sur/Monterey 10.16
Matrix products: default
BLAS: /Library/Frameworks/R.framework/Versions/4.2/Resources/lib/libRblas.0.dylib
LAPACK: /Library/Frameworks/R.framework/Versions/4.2/Resources/lib/libRlapack.dylib
locale:
[1] en_US.UTF-8/en_US.UTF-8/en_US.UTF-8/C/en_US.UTF-8/en_US.UTF-8
attached base packages:
[1] grid stats4 stats graphics grDevices utils datasets
[8] methods base
other attached packages:
[1] circlize_0.4.15
[2] networkD3_0.4
[3] scales_1.2.1
[4] ggraph_2.1.0
[5] igraph_1.5.1
[6] ReactomePA_1.40.0
[7] impute_1.70.0
[8] WGCNA_1.72-1
[9] fastcluster_1.2.3
[10] dynamicTreeCut_1.63-1
[11] BioNERO_1.4.2
[12] reshape2_1.4.4
[13] ggridges_0.5.4
[14] biomaRt_2.52.0
[15] ggvenn_0.1.10
[16] UpSetR_1.4.0
[17] DOSE_3.22.1
[18] variancePartition_1.26.0
[19] clusterProfiler_4.4.4
[20] pheatmap_1.0.12
[21] qvalue_2.28.0
[22] Homo.sapiens_1.3.1
[23] TxDb.Hsapiens.UCSC.hg19.knownGene_3.2.2
[24] org.Hs.eg.db_3.15.0
[25] GO.db_3.15.0
[26] OrganismDbi_1.38.1
[27] GenomicFeatures_1.48.4
[28] AnnotationDbi_1.58.0
[29] cluster_2.1.4
[30] ggfortify_0.4.16
[31] lubridate_1.9.2
[32] forcats_1.0.0
[33] stringr_1.5.0
[34] dplyr_1.1.2
[35] purrr_1.0.2
[36] readr_2.1.4
[37] tidyr_1.3.0
[38] tibble_3.2.1
[39] ggplot2_3.4.3
[40] tidyverse_2.0.0
[41] RColorBrewer_1.1-3
[42] RUVSeq_1.30.0
[43] edgeR_3.38.4
[44] limma_3.52.4
[45] EDASeq_2.30.0
[46] ShortRead_1.54.0
[47] GenomicAlignments_1.32.1
[48] SummarizedExperiment_1.26.1
[49] MatrixGenerics_1.8.1
[50] matrixStats_1.0.0
[51] Rsamtools_2.12.0
[52] GenomicRanges_1.48.0
[53] Biostrings_2.64.1
[54] GenomeInfoDb_1.32.4
[55] XVector_0.36.0
[56] IRanges_2.30.1
[57] S4Vectors_0.34.0
[58] BiocParallel_1.30.4
[59] Biobase_2.56.0
[60] BiocGenerics_0.42.0
[61] workflowr_1.7.1
loaded via a namespace (and not attached):
[1] rappdirs_0.3.3 rtracklayer_1.56.1 minet_3.54.0
[4] R.methodsS3_1.8.2 coda_0.19-4 bit64_4.0.5
[7] knitr_1.43 aroma.light_3.26.0 DelayedArray_0.22.0
[10] R.utils_2.12.2 rpart_4.1.19 data.table_1.14.8
[13] hwriter_1.3.2.1 KEGGREST_1.36.3 RCurl_1.98-1.12
[16] doParallel_1.0.17 generics_0.1.3 preprocessCore_1.58.0
[19] callr_3.7.3 RhpcBLASctl_0.23-42 RSQLite_2.3.1
[22] shadowtext_0.1.2 bit_4.0.5 tzdb_0.4.0
[25] enrichplot_1.16.2 xml2_1.3.5 httpuv_1.6.11
[28] viridis_0.6.4 xfun_0.40 hms_1.1.3
[31] jquerylib_0.1.4 evaluate_0.21 promises_1.2.1
[34] fansi_1.0.4 restfulr_0.0.15 progress_1.2.2
[37] caTools_1.18.2 dbplyr_2.3.3 htmlwidgets_1.6.2
[40] DBI_1.1.3 ggnewscale_0.4.9 backports_1.4.1
[43] annotate_1.74.0 aod_1.3.2 deldir_1.0-9
[46] vctrs_0.6.3 abind_1.4-5 cachem_1.0.8
[49] withr_2.5.0 ggforce_0.4.1 checkmate_2.2.0
[52] treeio_1.20.2 prettyunits_1.1.1 ape_5.7-1
[55] lazyeval_0.2.2 crayon_1.5.2 genefilter_1.78.0
[58] labeling_0.4.2 pkgconfig_2.0.3 tweenr_2.0.2
[61] nlme_3.1-163 nnet_7.3-19 rlang_1.1.1
[64] lifecycle_1.0.3 downloader_0.4 filelock_1.0.2
[67] BiocFileCache_2.4.0 rprojroot_2.0.3 polyclip_1.10-4
[70] graph_1.74.0 Matrix_1.5-4.1 aplot_0.2.0
[73] NetRep_1.2.7 boot_1.3-28.1 base64enc_0.1-3
[76] GlobalOptions_0.1.2 whisker_0.4.1 processx_3.8.2
[79] png_0.1-8 viridisLite_0.4.2 rjson_0.2.21
[82] bitops_1.0-7 getPass_0.2-2 R.oo_1.25.0
[85] ggnetwork_0.5.12 KernSmooth_2.23-22 blob_1.2.4
[88] shape_1.4.6 jpeg_0.1-10 gridGraphics_0.5-1
[91] reactome.db_1.81.0 graphite_1.42.0 memoise_2.0.1
[94] magrittr_2.0.3 plyr_1.8.8 gplots_3.1.3
[97] zlibbioc_1.42.0 compiler_4.2.0 scatterpie_0.2.1
[100] BiocIO_1.6.0 clue_0.3-64 intergraph_2.0-3
[103] lme4_1.1-34 cli_3.6.1 patchwork_1.1.3
[106] ps_1.7.5 htmlTable_2.4.1 Formula_1.2-5
[109] mgcv_1.9-0 MASS_7.3-60 tidyselect_1.2.0
[112] stringi_1.7.12 highr_0.10 yaml_2.3.7
[115] GOSemSim_2.22.0 locfit_1.5-9.8 latticeExtra_0.6-30
[118] ggrepel_0.9.3 sass_0.4.7 fastmatch_1.1-4
[121] tools_4.2.0 timechange_0.2.0 parallel_4.2.0
[124] rstudioapi_0.15.0 foreign_0.8-84 foreach_1.5.2
[127] git2r_0.32.0 gridExtra_2.3 farver_2.1.1
[130] digest_0.6.33 BiocManager_1.30.22 Rcpp_1.0.11
[133] broom_1.0.5 later_1.3.1 httr_1.4.7
[136] ComplexHeatmap_2.12.1 GENIE3_1.18.0 Rdpack_2.5
[139] colorspace_2.1-0 XML_3.99-0.14 fs_1.6.3
[142] splines_4.2.0 statmod_1.5.0 yulab.utils_0.0.8
[145] RBGL_1.72.0 tidytree_0.4.5 graphlayouts_1.0.0
[148] ggplotify_0.1.2 xtable_1.8-4 jsonlite_1.8.7
[151] nloptr_2.0.3 ggtree_3.4.4 tidygraph_1.2.3
[154] ggfun_0.1.2 R6_2.5.1 Hmisc_5.1-0
[157] pillar_1.9.0 htmltools_0.5.6 glue_1.6.2
[160] fastmap_1.1.1 minqa_1.2.5 codetools_0.2-19
[163] fgsea_1.22.0 utf8_1.2.3 sva_3.44.0
[166] lattice_0.21-8 bslib_0.5.1 network_1.18.1
[169] pbkrtest_0.5.2 curl_5.0.2 gtools_3.9.4
[172] interp_1.1-4 survival_3.5-7 statnet.common_4.9.0
[175] rmarkdown_2.24 munsell_0.5.0 GetoptLong_1.0.5
[178] DO.db_2.9 GenomeInfoDbData_1.2.8 iterators_1.0.14
[181] gtable_0.3.4 rbibutils_2.2.15