Johnson_DOX_24_4
Omar Johnson
2024-07-18
Last updated: 2024-07-23
Checks: 7 0
Knit directory: DOX_24_Github/
This reproducible R Markdown analysis was created with workflowr (version 1.7.1). The Checks tab describes the reproducibility checks that were applied when the results were created. The Past versions tab lists the development history.
Great! Since the R Markdown file has been committed to the Git repository, you know the exact version of the code that produced these results.
Great job! The global environment was empty. Objects defined in the global environment can affect the analysis in your R Markdown file in unknown ways. For reproduciblity it’s best to always run the code in an empty environment.
The command set.seed(20240723) was run prior to running
the code in the R Markdown file. Setting a seed ensures that any results
that rely on randomness, e.g. subsampling or permutations, are
reproducible.
Great job! Recording the operating system, R version, and package versions is critical for reproducibility.
Nice! There were no cached chunks for this analysis, so you can be confident that you successfully produced the results during this run.
Great job! Using relative paths to the files within your workflowr project makes it easier to run your code on other machines.
Great! You are using Git for version control. Tracking code development and connecting the code version to the results is critical for reproducibility.
The results in this page were generated with repository version 85b4737. See the Past versions tab to see a history of the changes made to the R Markdown and HTML files.
Note that you need to be careful to ensure that all relevant files for
the analysis have been committed to Git prior to generating the results
(you can use wflow_publish or
wflow_git_commit). workflowr only checks the R Markdown
file, but you know if there are other scripts or data files that it
depends on. Below is the status of the Git repository when the results
were generated:
Ignored files:
    Ignored:    .DS_Store

Untracked files:
    Untracked:  Johnson_DOX_24_1.Rmd
    Untracked:  Johnson_DOX_24_2.Rmd
    Untracked:  Johnson_DOX_24_3.Rmd
    Untracked:  Johnson_DOX_24_4.Rmd
    Untracked:  Johnson_DOX_24_5.Rmd
    Untracked:  Johnson_DOX_24_7.Rmd
    Untracked:  Johnson_DOX_24_RUV_Limma.Rmd
    Untracked:  Johnson_DOX_24_RUV_Limma.html
    Untracked:  VennDiagram.2024-07-23_18-08-30.log
    Untracked:  VennDiagram.2024-07-23_18-08-31.log
Note that any generated files, e.g. HTML, png, CSS, etc., are not included in this status report because it is ok for generated content to have uncommitted changes.
These are the previous versions of the repository in which changes were
made to the R Markdown (analysis/Johnson_DOX_24_4.Rmd) and
HTML (docs/Johnson_DOX_24_4.html) files. If you’ve
configured a remote Git repository (see ?wflow_git_remote),
click on the hyperlinks in the table below to view the files as they
were in that past version.
| File | Version | Author | Date | Message |
|---|---|---|---|---|
| Rmd | 85b4737 | Omar-Johnson | 2024-07-23 | more updates for paper |
| html | 50450f1 | Omar-Johnson | 2024-07-23 | Build site. |
| Rmd | 88c6686 | Omar-Johnson | 2024-07-23 | Publish the initial files for myproject |
Load Libraries
Read in Data
Functions
# 1
perform_module_comparisons_mutexc <- function(df, module_col, value_col) {
  # Ensure the necessary columns exist
  if (!(module_col %in% names(df) && value_col %in% names(df))) {
    stop("Specified columns do not exist in the dataframe.")
  }

  # Get a list of all unique modules
  modules <- unique(df[[module_col]])

  # Initialize an empty dataframe to store results
  results <- data.frame(Module1 = character(),
                        Module2 = character(),
                        WilcoxPValue = numeric(),
                        stringsAsFactors = FALSE)

  # Loop through each module
  for (module in modules) {
    # Data for the current module
    current_data <- df %>% filter(!!sym(module_col) == module) %>% pull(!!sym(value_col))

    # Data for all other modules
    other_data <- df %>% filter(!!sym(module_col) != module) %>% pull(!!sym(value_col))

    # Perform the Wilcoxon test
    test_result <- wilcox.test(current_data, other_data)

    # Add the results to the dataframe
    results <- rbind(results, data.frame(Module1 = module,
                                         Module2 = "Others",
                                         WilcoxPValue = test_result$p.value))
  }

  return(results)
}


# 2
perform_module_comparisons_mutexc_2 <- function(df, module_col, value_col) {
  # Ensure the necessary columns exist
  if (!(module_col %in% names(df) && value_col %in% names(df))) {
    stop("Specified columns do not exist in the dataframe.")
  }

  # Get a list of all unique modules
  modules <- unique(df[[module_col]])

  # Initialize an empty list to store combined data frames
  combined_df_list <- list()

  # Initialize an empty dataframe to store results
  results <- data.frame(Module1 = character(),
                        Module2 = character(),
                        WilcoxPValue = numeric(),
                        stringsAsFactors = FALSE)

  # Loop through each module
  for (module in modules) {
    # Data for the current module
    current_data <- df %>% filter(!!sym(module_col) == module) %>%
                    mutate(Group = as.character(module))

    # Data for all other modules
    other_data <- df %>% filter(!!sym(module_col) != module) %>%
                    mutate(Group = paste("Not", module, sep=""))

    # Combine current module data with other module data
    combined_data <- rbind(current_data, other_data)

    # Add the combined data to the list
    combined_df_list[[module]] <- combined_data

    # Perform the Wilcoxon test
    test_result <- wilcox.test(current_data[[value_col]], other_data[[value_col]])

    # Add the results to the dataframe
    results <- rbind(results, data.frame(Module1 = module,
                                         Module2 = "Others",
                                         WilcoxPValue = test_result$p.value))
  }

  return(list("results" = results, "combined_data" = combined_df_list))
}


# 3
# Generate enrichment function limited to the EXPRESSED proteins.
perform_module_disease_analysis_2 <- function(toptable, diseaseGenes) {
  # Prepare an empty list to collect results
  results <- list()

  # Ensure 'Modules' and 'Protein' columns exist in 'toptable'
  if(!"Modules" %in% names(toptable)) {
    stop("Column 'Modules' not found in the 'toptable'.")
  }
  if(!"Protein" %in% names(toptable)) {
    stop("Column 'Protein' not found in the 'toptable'.")
  }

  # Filter disease genes to include only those that are expressed in toptable
  expressedDiseaseGenes <- lapply(diseaseGenes, function(genes) {
    intersect(genes, toptable$Protein)
  })

  # Loop through each module
  modules <- unique(toptable$Modules)
  for (module in modules) {
    # Get the proteins in the module
    moduleGenes <- toptable$Protein[toptable$Modules == module]

    # Loop through each disease gene set
    for (diseaseName in names(expressedDiseaseGenes)) {
      # Find the intersecting genes between the module and the expressed disease genes
      diseaseModuleIntersect <- intersect(moduleGenes, expressedDiseaseGenes[[diseaseName]])

      # Calculate elements for the contingency table
      numIntersect = length(diseaseModuleIntersect)
      numInModuleNotDisease = length(moduleGenes) - numIntersect
      numInDiseaseNotModule = length(expressedDiseaseGenes[[diseaseName]]) - numIntersect
      numInNeither = nrow(toptable) - (numIntersect + numInModuleNotDisease + numInDiseaseNotModule)

      # Build the contingency table
      table <- matrix(c(
        numIntersect, # Both in disease list and module
        numInModuleNotDisease, # In module but not disease list
        numInDiseaseNotModule, # In disease list but not module
        numInNeither # In neither list
      ), nrow = 2, byrow = TRUE)

      # Perform chi-squared test and Fisher's exact test with error handling
      chiSqTestResult <- tryCatch({
        chisq.test(table, correct = TRUE)
      }, error = function(e) {
        list(p.value = NA)
      }, warning = function(w) {
        list(p.value = NA)
      })

      fisherTestResult <- tryCatch({
        fisher.test(table)
      }, error = function(e) {
        list(p.value = NA, odds.ratio = NA)
      }, warning = function(w) {
        list(p.value = NA, odds.ratio = NA)
      })

      # Calculate percent overlap, handle division by zero
      percentOverlap <- if (length(moduleGenes) > 0) {
        (numIntersect / length(expressedDiseaseGenes[[diseaseName]])) * 100
      } else {
        0
      }

      # Convert intersecting genes to a single character string
      intersectingGenesStr <- if (numIntersect > 0) {
        paste(diseaseModuleIntersect, collapse = ";")
      } else {
        ""  # Use an empty string to indicate no intersection
      }

      # Append to results list
      results[[paste(module, diseaseName, sep = "_")]] <- data.frame(
        Modules = module,
        Disease = diseaseName,
        ChiSqPValue = chiSqTestResult$p.value,
        FisherPValue = fisherTestResult$p.value,
        OddsRatio = fisherTestResult$estimate,
        PercentOverlap = percentOverlap,
        IntersectingGenes = intersectingGenesStr
      )
    }
  }

  # Combine results into a single data frame
  combined_df <- do.call(rbind, results)
  return(combined_df)
}


# 4
# For testing for enrichment in the circos plot
perform_module_disease_analysis <- function(toptable, diseaseGenes) {
  # Prepare an empty list to collect results
  results <- list()

  # Ensure 'Modules' and 'Protein' columns exist in 'toptable'
  if(!"Modules" %in% names(toptable)) {
    stop("Column 'Modules' not found in the 'toptable'.")
  }
  if(!"Protein" %in% names(toptable)) {
    stop("Column 'Protein' not found in the 'toptable'.")
  }

  # Filter disease genes to include only those that are expressed in toptable
  expressedDiseaseGenes <- lapply(diseaseGenes, function(genes) {
    intersect(genes, toptable$Protein)
  })

  # Loop through each module
  modules <- unique(toptable$Modules)
  for (module in modules) {
    # Get the genes in the module
    moduleGenes <- toptable$Protein[toptable$Modules == module]

    # Loop through each disease gene set
    for (diseaseName in names(expressedDiseaseGenes)) {
      # Find the intersecting genes between the module and the expressed disease genes
      diseaseModuleIntersect <- intersect(moduleGenes, expressedDiseaseGenes[[diseaseName]])

      # Calculate elements for the contingency table
      numIntersect = length(diseaseModuleIntersect)
      numInModuleNotDisease = length(moduleGenes) - numIntersect
      numInDiseaseNotModule = length(expressedDiseaseGenes[[diseaseName]]) - numIntersect
      numInNeither = nrow(toptable) - (numIntersect + numInModuleNotDisease + numInDiseaseNotModule)

      # Build the contingency table
      table <- matrix(c(
        numIntersect, # Both in disease list and module
        numInModuleNotDisease, # In module but not disease list
        numInDiseaseNotModule, # In disease list but not module
        numInNeither # In neither list
      ), nrow = 2, byrow = TRUE)

      # Perform chi-squared test and Fisher's exact test with error handling
      chiSqTestResult <- tryCatch({
        chisq.test(table, correct = TRUE)
      }, error = function(e) {
        list(p.value = NA)
      }, warning = function(w) {
        list(p.value = NA)
      })

      fisherTestResult <- tryCatch({
        fisher.test(table)
      }, error = function(e) {
        list(p.value = NA)
      }, warning = function(w) {
        list(p.value = NA)
      })

      # Calculate percent overlap, handle division by zero
      percentOverlap <- if (length(moduleGenes) > 0) {
        (numIntersect / length(expressedDiseaseGenes[[diseaseName]])) * 100
      } else {
        0
      }

      # Convert intersecting genes to a single character string
      intersectingGenesStr <- if (numIntersect > 0) {
        paste(diseaseModuleIntersect, collapse = ";")
      } else {
        ""  # Use an empty string to indicate no intersection
      }

      # Append to results list
      results[[paste(module, diseaseName, sep = "_")]] <- data.frame(
        Modules = module,
        Disease = diseaseName,
        ChiSqPValue = chiSqTestResult$p.value,
        FisherPValue = fisherTestResult$p.value,
        PercentOverlap = percentOverlap,
        IntersectingGenes = intersectingGenesStr
      )
    }
  }

  # Combine results into a single data frame
  results_df <- do.call(rbind, results)
  return(results_df)
}
Fig-4A & S9 Biological process enrichment
GO_results_DOX %>% head() X ONTOLOGY ID
1 1 BP GO:0006396
2 2 BP GO:0006397
3 3 BP GO:0016071
4 4 BP GO:0008380
5 5 BP GO:0000375
6 6 BP GO:0000377
Description
1 RNA processing
2 mRNA processing
3 mRNA metabolic process
4 RNA splicing
5 RNA splicing, via transesterification reactions
6 RNA splicing, via transesterification reactions with bulged adenosine as nucleophile
GeneRatio BgRatio pvalue p.adjust qvalue
1 187/549 442/3999 9.515453e-58 2.681455e-54 2.496054e-54
2 127/549 256/3999 5.146303e-47 7.014120e-44 6.529150e-44
3 148/549 337/3999 7.467126e-47 7.014120e-44 6.529150e-44
4 103/549 221/3999 1.215885e-34 8.565909e-32 7.973645e-32
5 82/549 166/3999 1.043049e-29 5.878626e-27 5.472166e-27
6 80/549 164/3999 1.702370e-28 6.853254e-26 6.379407e-26
geneID
1 SUPT5H/SAP18/PES1/TCERG1/U2SURP/DHX15/RNMT/RRP8/PRPF4/RBFOX2/SART1/HNRNPR/PRPF3/PPIH/PLRG1/DHX16/KDM1A/SYNCRIP/PQBP1/PTCD1/RNF40/PRPF40A/NPM3/POP7/BCAS2/SMNDC1/RSL1D1/PRPF6/RPP14/SCAF4/LUC7L3/CELF2/PARN/CPSF4/LSM8/SNRPA/HNRNPL/DDX5/SON/NCL/U2AF2/PTBP1/RBMS1/TIA1/COIL/MTREX/RPS27/NOP2/RBM25/HNRNPM/ADAR/HNRNPH2/HNRNPK/SNRPF/LSM6/SUPT4H1/RPP30/RBM10/HNRNPU/U2AF1/SRSF2/EXOSC10/SRSF11/EXOSC9/KHDRBS1/SRSF1/GRSF1/SF3A3/IK/TARDBP/HNRNPA0/SRSF5/SRSF6/PPIG/SF3B2/PRPF4B/SNW1/THOC5/DDX39B/EXOSC2/CIRBP/HNRNPD/FRG1/RBM39/RRP1B/ZNF638/EXOSC7/NONO/RNPS1/SAFB/SF3A2/SF3A1/SF1/TSR1/SMU1/LARP7/NCBP3/USP39/ZNF326/NOL9/SPOUT1/RBM20/RBM26/INTS11/RPRD2/INTS3/PDE12/ZCCHC8/RPUSD3/CDC73/PRPF8/ALKBH5/INTS5/CTR9/ZC3H14/FIP1L1/TRMT1L/NOP9/PABPN1/SUGP2/FTSJ3/CCAR2/INTS1/CPSF7/PAF1/PRPF38A/DDX54/BRIX1/HNRNPLL/PRPF31/SREK1/DDX17/CELF1/KHSRP/RBPMS/EXOSC8/NSUN4/SNRNP40/MTFMT/THOC1/INTS4/RBM17/RPRD1A/RBM14/QKI/SLC38A2/IWS1/CDC5L/POP1/HNRNPUL1/DDX23/TRMT61B/RBM4/RBM24/QTRT1/MAK16/GTPBP4/WDR33/NAT10/XRN2/INTS2/PNN/TFB2M/EXOSC4/EXOSC5/DDX21/INTS7/DDX18/INTS10/MTPAP/SLTM/DDX56/FASTKD2/PUF60/PTBP2/MRTO4/ACIN1/PRPF19/SCAF8/SRRM2/THRAP3/WBP11/LSM2/EXOSC1/YTHDF2/RBM8A/NCOR2
2 SUPT5H/SAP18/TCERG1/DHX15/RNMT/PRPF4/RBFOX2/SART1/HNRNPR/PRPF3/PPIH/PLRG1/DHX16/KDM1A/SYNCRIP/PQBP1/RNF40/PRPF40A/BCAS2/SMNDC1/PRPF6/SCAF4/LUC7L3/CELF2/CPSF4/LSM8/SNRPA/HNRNPL/DDX5/SON/NCL/U2AF2/PTBP1/TIA1/COIL/MTREX/RBM25/HNRNPM/ADAR/HNRNPK/SNRPF/LSM6/SUPT4H1/RBM10/HNRNPU/U2AF1/SRSF2/SRSF11/KHDRBS1/SRSF1/GRSF1/SF3A3/IK/TARDBP/HNRNPA0/SRSF5/SRSF6/SF3B2/PRPF4B/SNW1/THOC5/DDX39B/CIRBP/FRG1/RBM39/RRP1B/NONO/RNPS1/SAFB/SF3A2/SF3A1/SF1/SMU1/LARP7/NCBP3/USP39/ZNF326/RBM20/RBM26/RPRD2/PDE12/ZCCHC8/RPUSD3/CDC73/PRPF8/ALKBH5/CTR9/ZC3H14/FIP1L1/PABPN1/SUGP2/CCAR2/CPSF7/PAF1/PRPF38A/HNRNPLL/PRPF31/SREK1/DDX17/CELF1/KHSRP/SNRNP40/THOC1/RBM17/RPRD1A/RBM14/QKI/IWS1/CDC5L/DDX23/RBM4/RBM24/WDR33/XRN2/PNN/MTPAP/SLTM/PUF60/PTBP2/ACIN1/PRPF19/SCAF8/SRRM2/THRAP3/WBP11/LSM2/RBM8A
3 SUPT5H/SAP18/TCERG1/DHX15/RNMT/PRPF4/RBFOX2/SART1/HNRNPR/PRPF3/PPIH/PLRG1/DHX16/KDM1A/SYNCRIP/PQBP1/RNF40/PRPF40A/BCAS2/SMNDC1/PRPF6/SCAF4/LUC7L3/CELF2/PARN/CPSF4/LSM8/NPM1/SNRPA/HNRNPL/YBX3/DDX5/SON/NCL/U2AF2/PTBP1/TIA1/COIL/MTREX/RBM25/HNRNPM/ADAR/HNRNPK/SNRPF/LSM6/SUPT4H1/RBM10/HNRNPU/U2AF1/SRSF2/EXOSC10/SRSF11/EXOSC9/KHDRBS1/SRSF1/GRSF1/SF3A3/IK/TARDBP/HNRNPA0/SRSF5/SRSF6/SF3B2/PRPF4B/SNW1/THOC5/DDX39B/EXOSC2/CIRBP/HNRNPD/FRG1/RBM39/RRP1B/EXOSC7/NONO/RNPS1/PCBP2/SAFB/SF3A2/SF3A1/SF1/MED1/ELAVL1/SMU1/LARP7/NCBP3/USP39/ZNF326/RBM20/RBM26/RPRD2/PDE12/ZCCHC8/RPUSD3/CDC73/PRPF8/ALKBH5/CTR9/ZC3H14/FIP1L1/GIGYF2/PABPN1/SUGP2/CCAR2/CPSF7/PAF1/PRPF38A/HNRNPLL/ATXN2L/PRPF31/SREK1/DDX17/CELF1/UPF1/KHSRP/EXOSC8/SNRNP40/THOC1/RBM17/RPRD1A/RBM14/QKI/IWS1/CDC5L/DDX23/TRMT61B/RBM4/RBM24/WDR33/XRN2/PNN/EXOSC4/EXOSC5/MTPAP/SLTM/FASTKD2/PUF60/PTBP2/MRTO4/ACIN1/PRPF19/SCAF8/SRRM2/THRAP3/WBP11/LSM2/YTHDF2/RBM8A
4 SAP18/TCERG1/DHX15/PRPF4/RBFOX2/SART1/HNRNPR/PRPF3/PPIH/PLRG1/DHX16/KDM1A/SYNCRIP/PQBP1/PRPF40A/BCAS2/SMNDC1/PRPF6/LUC7L3/CELF2/LSM8/SNRPA/HNRNPL/DDX5/SON/NCL/U2AF2/PTBP1/TIA1/COIL/MTREX/RBM25/HNRNPM/HNRNPH2/HNRNPK/SNRPF/LSM6/RBM10/HNRNPU/U2AF1/SRSF2/SRSF11/KHDRBS1/SRSF1/GRSF1/SF3A3/IK/TARDBP/SRSF5/SRSF6/PPIG/SF3B2/PRPF4B/SNW1/THOC5/DDX39B/CIRBP/FRG1/RBM39/RRP1B/ZNF638/NONO/RNPS1/SF3A2/SF3A1/SF1/SMU1/LARP7/USP39/ZNF326/RBM20/ZCCHC8/PRPF8/SUGP2/CCAR2/PRPF38A/HNRNPLL/PRPF31/SREK1/DDX17/CELF1/KHSRP/SNRNP40/THOC1/RBM17/RBM14/QKI/SLC38A2/IWS1/CDC5L/DDX23/RBM4/RBM24/PNN/PUF60/PTBP2/ACIN1/PRPF19/SRRM2/THRAP3/WBP11/LSM2/RBM8A
5 SAP18/PRPF4/RBFOX2/SART1/HNRNPR/PRPF3/PPIH/PLRG1/DHX16/KDM1A/SYNCRIP/PQBP1/PRPF40A/BCAS2/SMNDC1/PRPF6/LUC7L3/CELF2/LSM8/SNRPA/HNRNPL/DDX5/SON/NCL/U2AF2/PTBP1/TIA1/COIL/MTREX/RBM25/HNRNPM/HNRNPK/SNRPF/LSM6/RBM10/HNRNPU/U2AF1/SRSF2/KHDRBS1/SRSF1/SF3A3/IK/SRSF5/SRSF6/SF3B2/PRPF4B/SNW1/DDX39B/CIRBP/FRG1/RBM39/RNPS1/SF3A2/SF3A1/SF1/SMU1/LARP7/USP39/ZCCHC8/PRPF8/PRPF38A/PRPF31/DDX17/CELF1/KHSRP/SNRNP40/RBM17/RBM14/QKI/CDC5L/DDX23/RBM4/RBM24/PNN/PUF60/PTBP2/PRPF19/SRRM2/THRAP3/WBP11/LSM2/RBM8A
6 SAP18/PRPF4/RBFOX2/SART1/HNRNPR/PRPF3/PPIH/PLRG1/DHX16/KDM1A/SYNCRIP/PQBP1/PRPF40A/BCAS2/PRPF6/LUC7L3/CELF2/LSM8/SNRPA/HNRNPL/DDX5/SON/NCL/U2AF2/PTBP1/TIA1/COIL/MTREX/RBM25/HNRNPM/HNRNPK/SNRPF/LSM6/RBM10/HNRNPU/U2AF1/SRSF2/KHDRBS1/SRSF1/SF3A3/IK/SRSF5/SRSF6/SF3B2/PRPF4B/SNW1/DDX39B/CIRBP/FRG1/RBM39/RNPS1/SF3A2/SF3A1/SF1/SMU1/LARP7/USP39/ZCCHC8/PRPF8/PRPF38A/PRPF31/DDX17/CELF1/SNRNP40/RBM17/RBM14/QKI/CDC5L/DDX23/RBM4/RBM24/PNN/PUF60/PTBP2/PRPF19/SRRM2/THRAP3/WBP11/LSM2/RBM8A
Count Module p.adj.log
1 187 green 123.35324
2 127 green 99.36582
3 148 green 99.36582
4 103 green 71.53493
5 82 green 60.39847
6 80 green 57.94249GO_results_DOX$ONTOLOGY %>% unique()[1] "BP"GO_results_DOX$Module %>% unique()[1] "green" "lightyellow" "salmon" "darkgreen" # Convert the data frame to a list
list_input <- GO_results_DOX %>%
group_by(Module) %>%
summarise(Description = list(Description)) %>%
deframe()
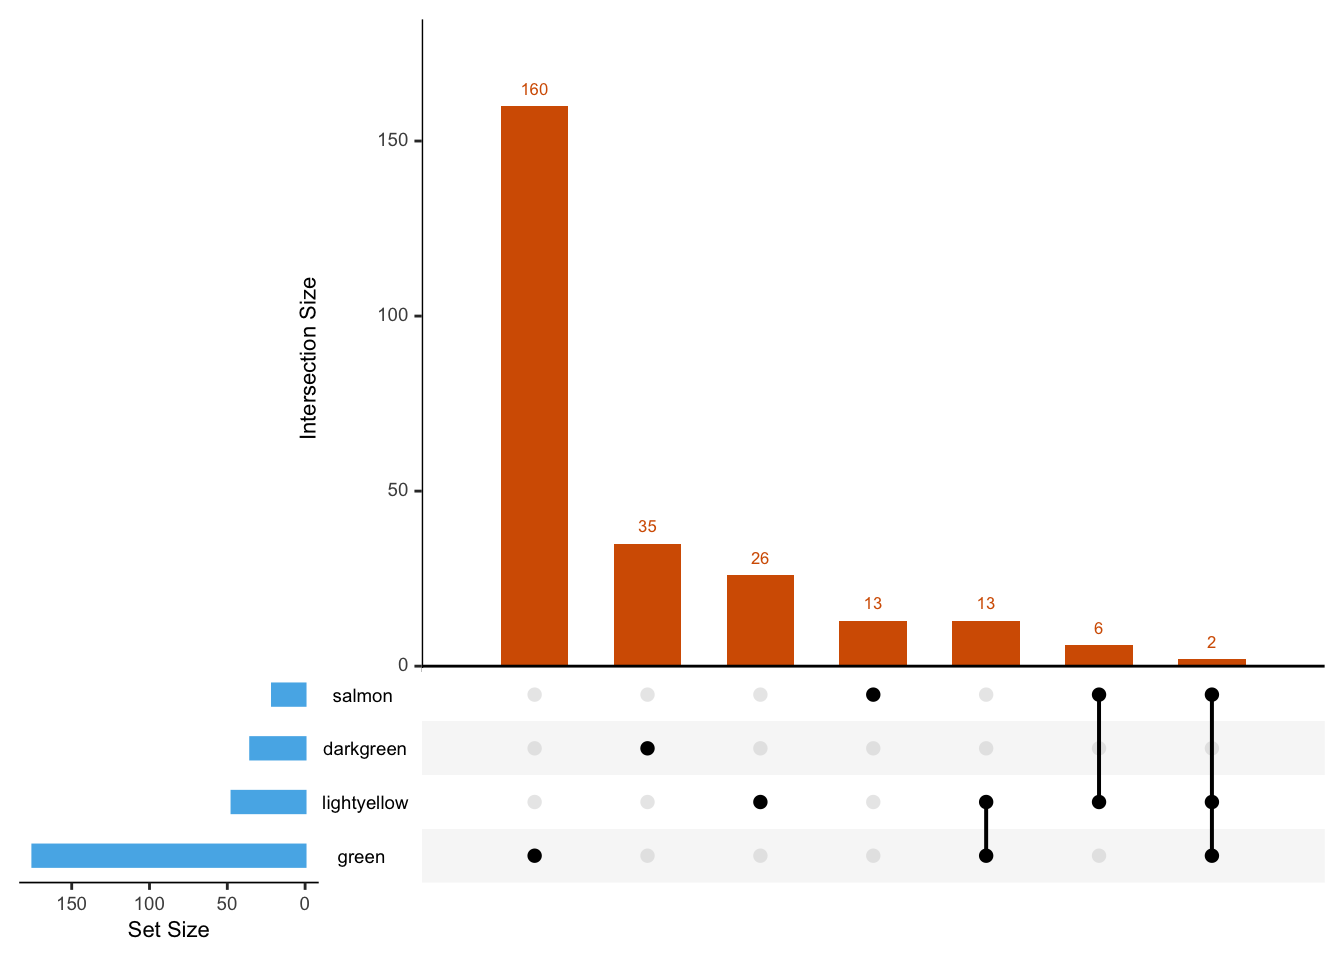
# Upset plot
upset(
fromList(list_input),
sets = names(list_input), # show all sets in the plot
order.by = "freq",
sets.bar.color = "#56B4E9",
matrix.color = "black",
main.bar.color = "#D55E00"
)
| Version | Author | Date |
|---|---|---|
| 50450f1 | Omar-Johnson | 2024-07-23 |
GO_results_DOX$p.adj.log <- -log(GO_results_DOX$p.adjust)
GO_results_DOX_green <- GO_results_DOX[GO_results_DOX$Module == "green", ]

GO_results_DOX_green_sorted <- GO_results_DOX_green[order(GO_results_DOX_green$p.adj.log), ]

GO_results_DOX_green_sorted$Description <-factor(GO_results_DOX_green_sorted$Description, levels = rev(GO_results_DOX_green_sorted$Description))


#
#
# GO_results_DOX_sorted <- GO_results_DOX[order(GO_results_DOX$p.adj.log), ]
#
# GO_results_DOX_sorted$Description <-factor(GO_results_DOX_sorted$Description, levels = GO_results_DOX_sorted$Description)


# Plotting
 ggplot(GO_results_DOX_green_sorted, aes(x = Description, y = p.adj.log, fill = Module)) +
  geom_bar(stat = "identity") +
  labs(title = "",
       x = "",
       y = "-log-adj. pval") +
  theme_classic() +
  theme(axis.text.x = element_text(angle = 45, hjust = 1))+
   scale_fill_identity()+
   ylim(c(0,130))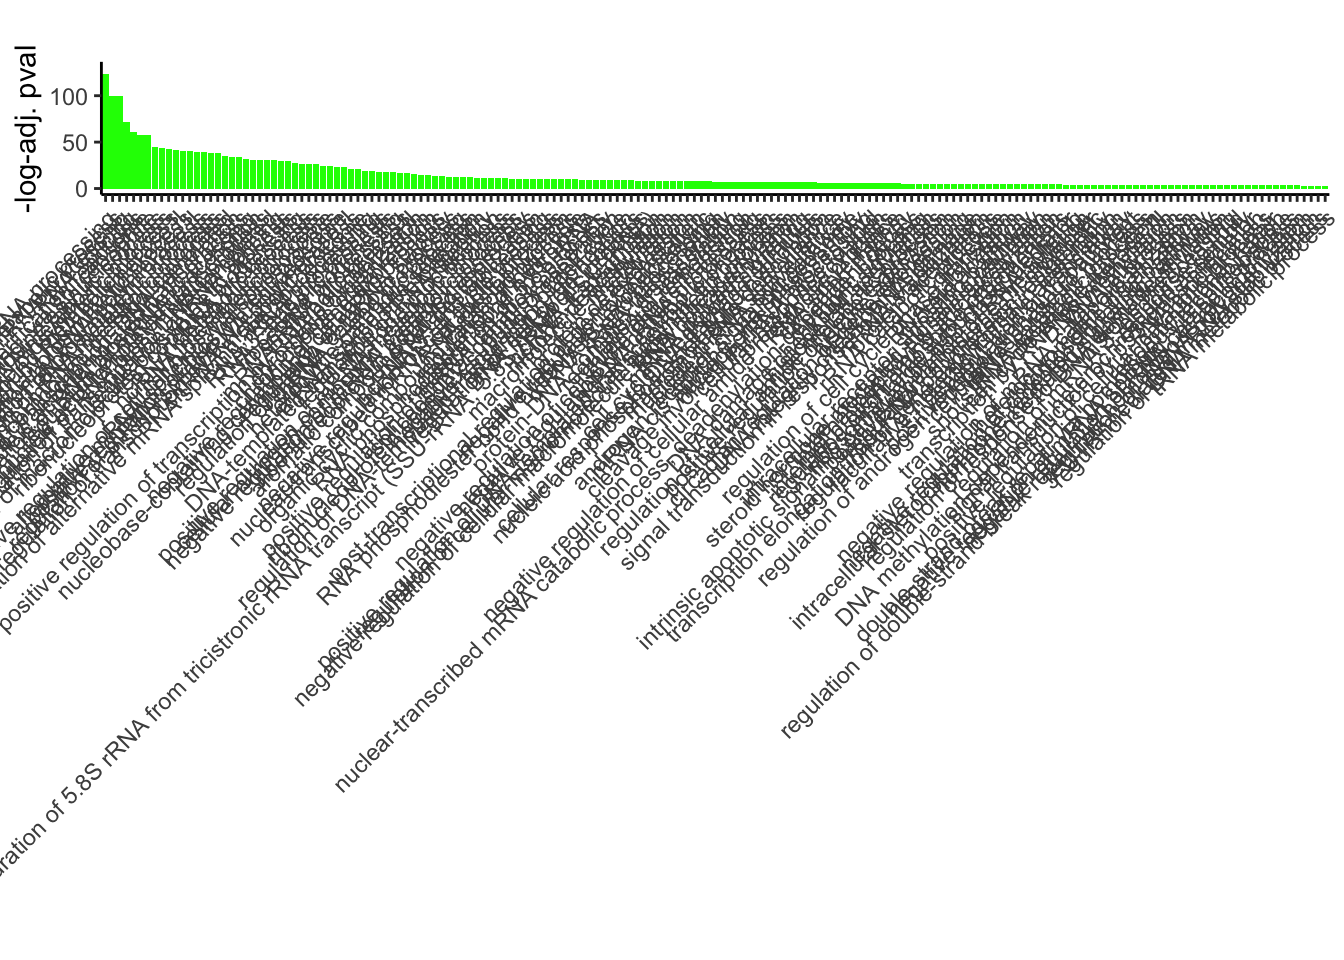
| Version | Author | Date |
|---|---|---|
| 50450f1 | Omar-Johnson | 2024-07-23 |
 # Plotting
 ggplot(GO_results_DOX_green_sorted[150:nrow(GO_results_DOX_green_sorted),  ], aes(x = Description, y = p.adj.log, fill = Module)) +
  geom_bar(stat = "identity") +
  labs(title = "",
       x = "",
       y = "-log-adj. pval") +
  theme_classic() +
  theme(axis.text.x = element_text(angle = 45, hjust = 1))+
   scale_fill_identity()+
   ylim(c(0,130))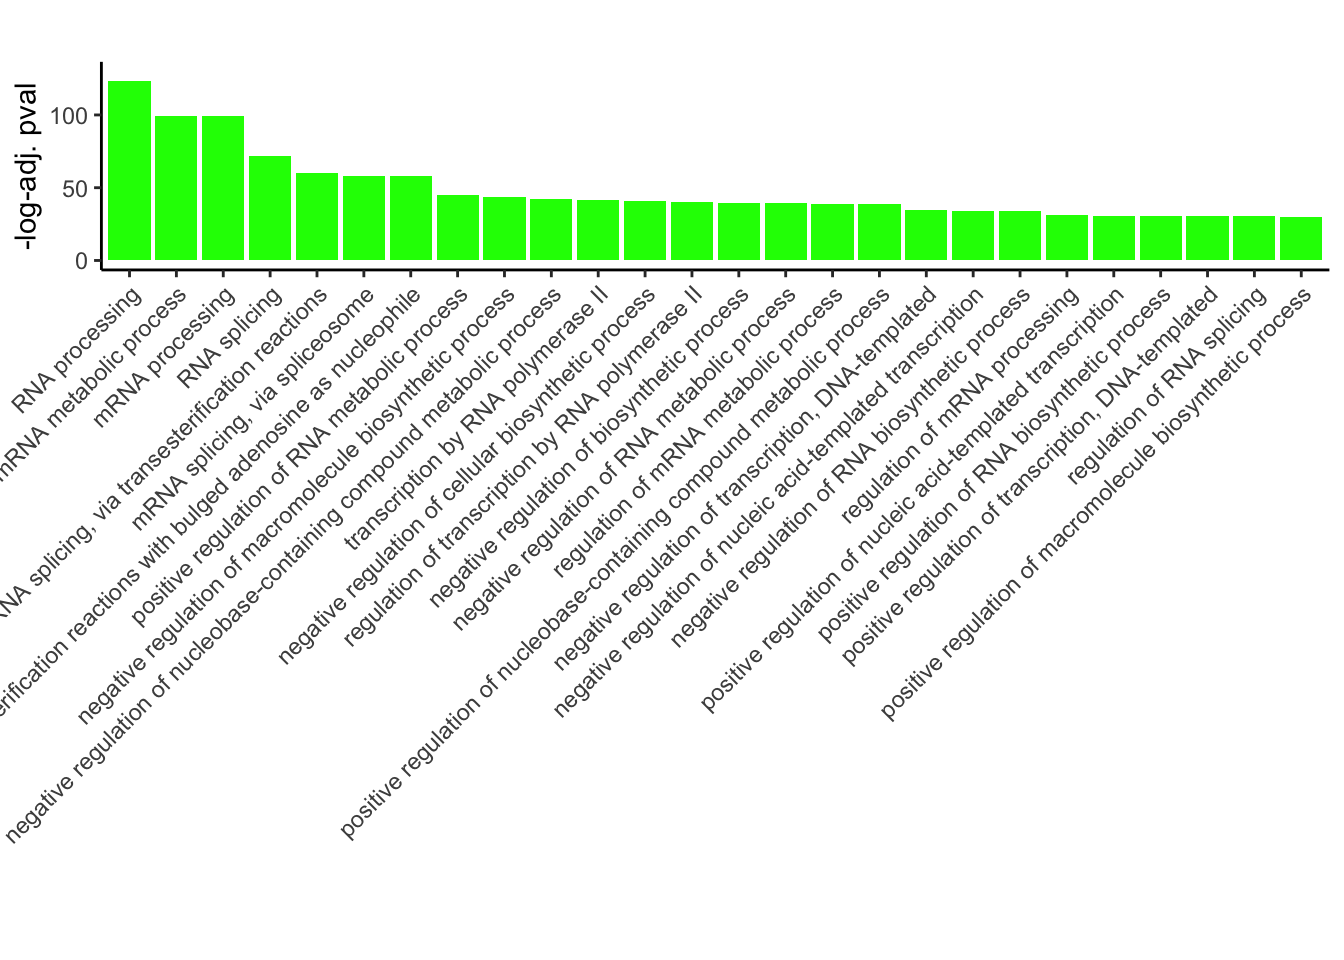
| Version | Author | Date |
|---|---|---|
| 50450f1 | Omar-Johnson | 2024-07-23 |
  # Plotting
 ggplot(GO_results_DOX_green_sorted[75:150,], aes(x = Description, y = p.adj.log, fill = Module)) +
  geom_bar(stat = "identity") +
  labs(title = "",
       x = "",
       y = "-log-adj. pval") +
  theme_classic() +
  theme(axis.text.x = element_text(angle = 45, hjust = 1))+
   scale_fill_identity()+
   ylim(c(0,130))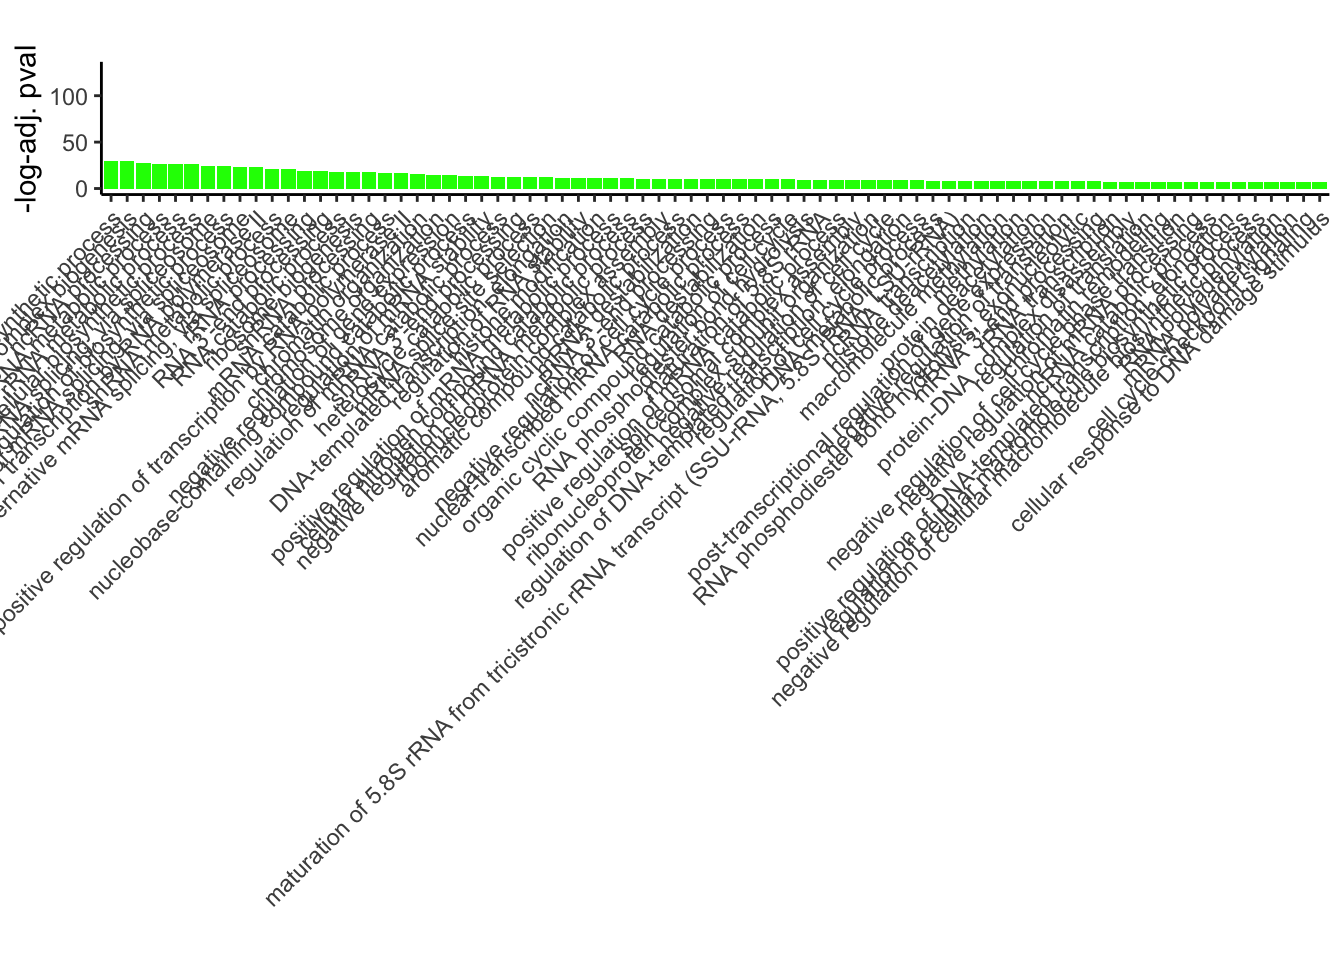
| Version | Author | Date |
|---|---|---|
| 50450f1 | Omar-Johnson | 2024-07-23 |
  # Plotting
 ggplot(GO_results_DOX_green_sorted[1:75, ], aes(x = Description, y = p.adj.log, fill = Module)) +
  geom_bar(stat = "identity") +
  labs(title = "",
       x = "",
       y = "-log-adj. pval") +
  theme_classic() +
  theme(axis.text.x = element_text(angle = 45, hjust = 1))+
   scale_fill_identity()+
   ylim(c(0,130))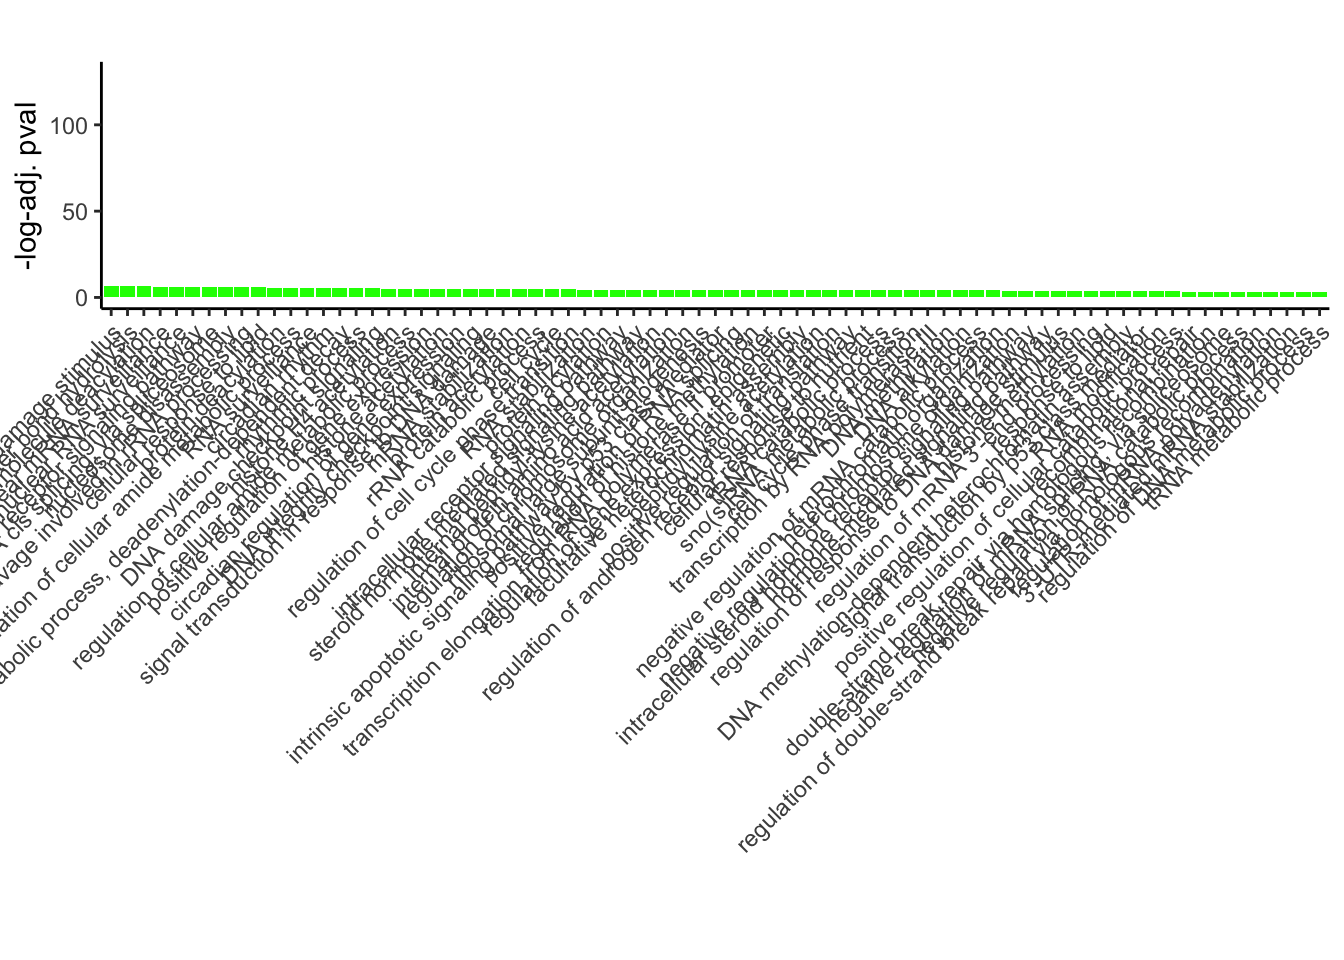
| Version | Author | Date |
|---|---|---|
| 50450f1 | Omar-Johnson | 2024-07-23 |
 GO_results_DOX$p.adj.log <- -log(GO_results_DOX$p.adjust)
GO_results_DOX_green <- GO_results_DOX[GO_results_DOX$Module == "darkgreen", ]

GO_results_DOX_green_sorted <- GO_results_DOX_green[order(GO_results_DOX_green$p.adj.log), ]

GO_results_DOX_green_sorted$Description <-factor(GO_results_DOX_green_sorted$Description, levels = rev(GO_results_DOX_green_sorted$Description))


# Plotting
 ggplot(GO_results_DOX_green_sorted, aes(x = Description, y = p.adj.log, fill = Module)) +
  geom_bar(stat = "identity") +
  labs(title = "",
       x = "",
       y = "-log-adj. pval") +
  theme_classic() +
  theme(axis.text.x = element_text(angle = 45, hjust = 1))+
   scale_fill_identity()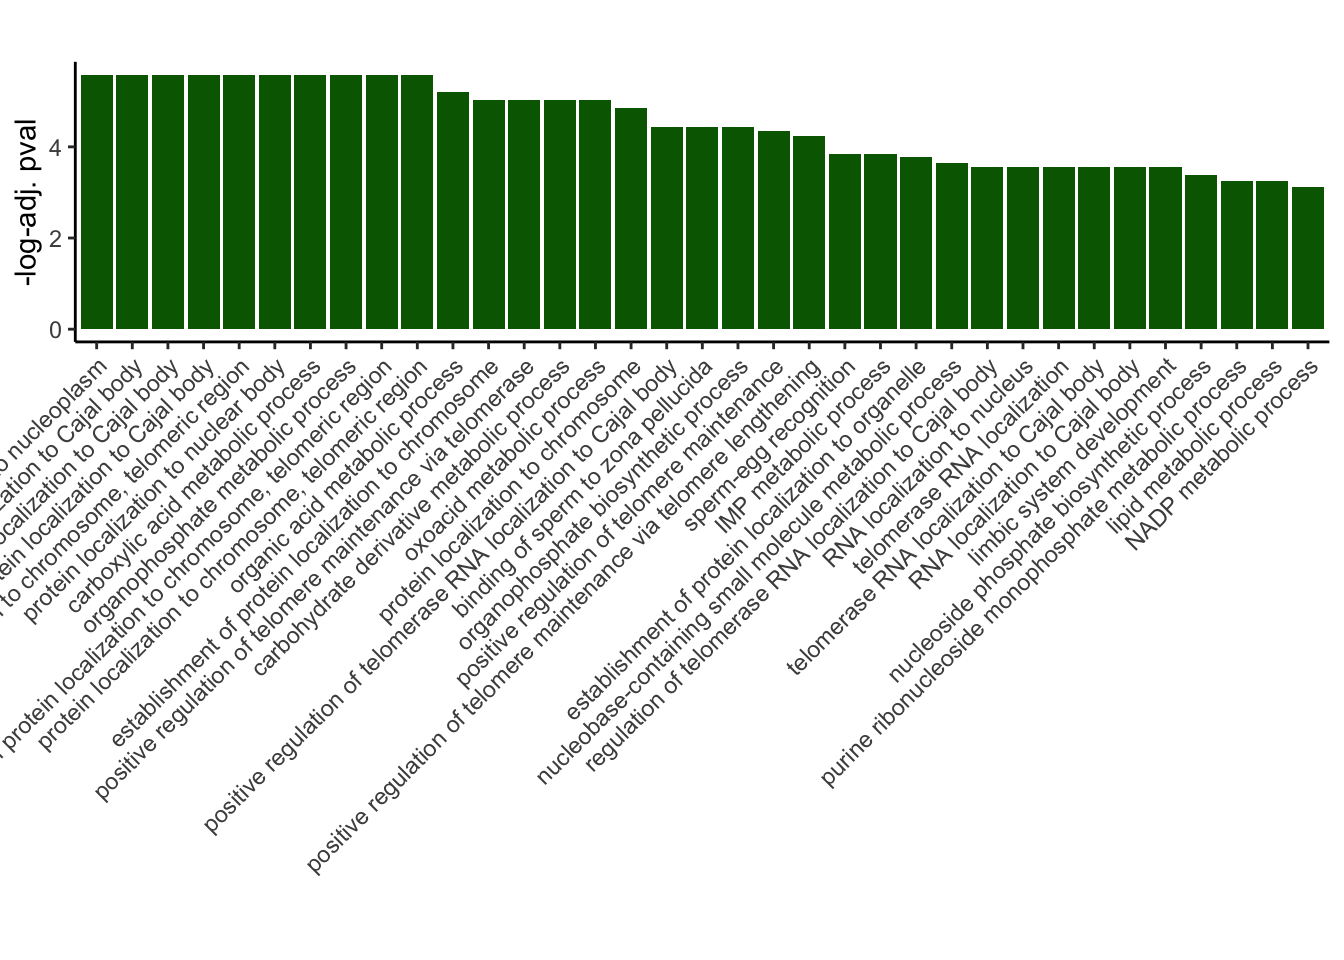
| Version | Author | Date |
|---|---|---|
| 50450f1 | Omar-Johnson | 2024-07-23 |
 GO_results_DOX$p.adj.log <- -log(GO_results_DOX$p.adjust)
GO_results_DOX_green <- GO_results_DOX[GO_results_DOX$Module == "salmon", ]

GO_results_DOX_green_sorted <- GO_results_DOX_green[order(GO_results_DOX_green$p.adj.log), ]

GO_results_DOX_green_sorted$Description <-factor(GO_results_DOX_green_sorted$Description, levels = rev(GO_results_DOX_green_sorted$Description))


# Plotting
 ggplot(GO_results_DOX_green_sorted, aes(x = Description, y = p.adj.log, fill = Module)) +
  geom_bar(stat = "identity") +
  labs(title = "",
       x = "",
       y = "-log-adj. pval") +
  theme_classic() +
  theme(axis.text.x = element_text(angle = 45, hjust = 1))+
   scale_fill_identity()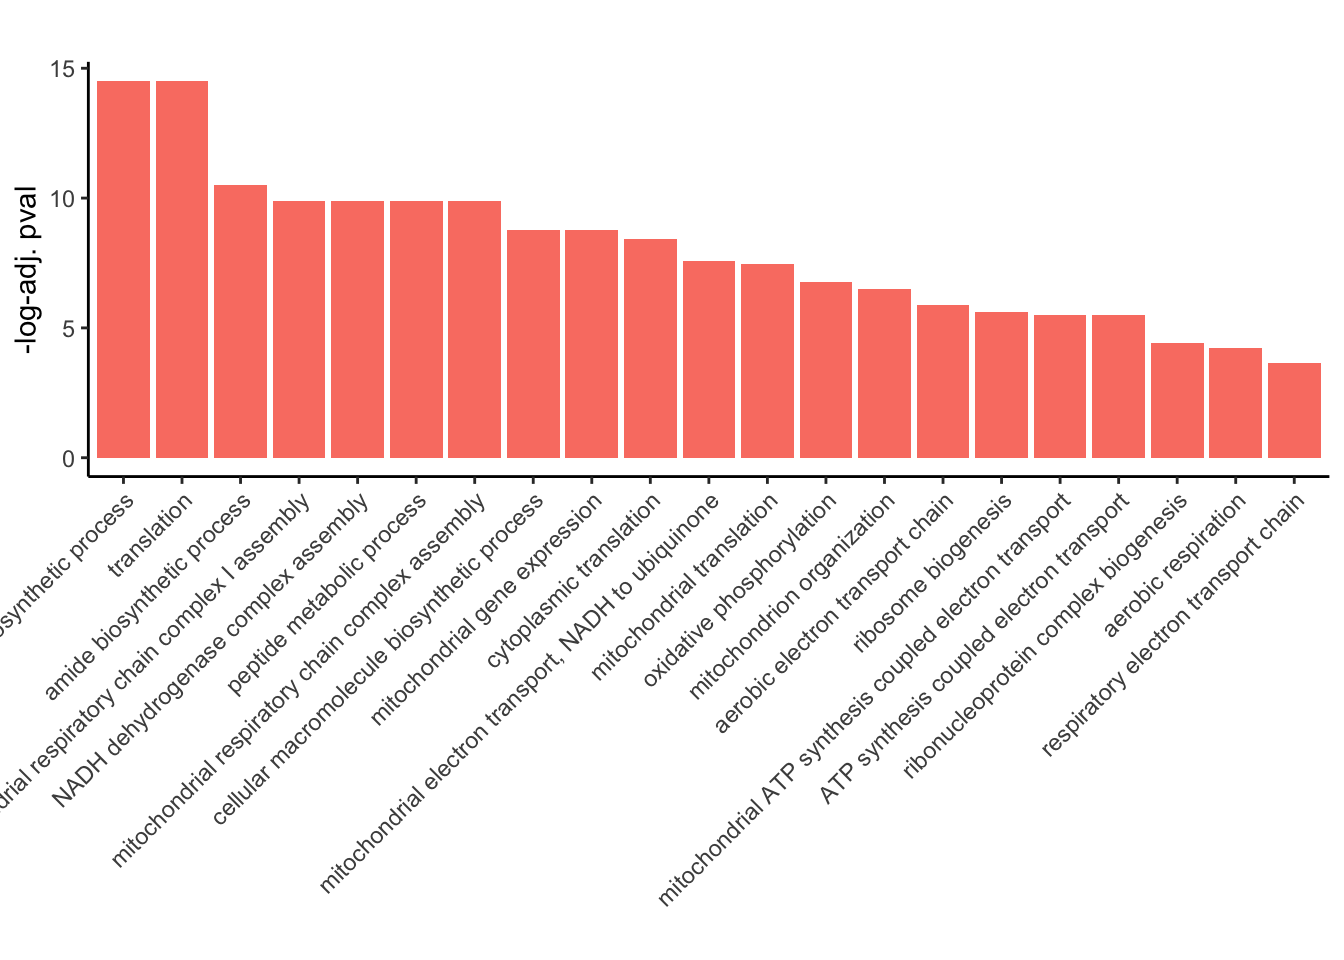
| Version | Author | Date |
|---|---|---|
| 50450f1 | Omar-Johnson | 2024-07-23 |
 GO_results_DOX$p.adj.log <- -log(GO_results_DOX$p.adjust)
GO_results_DOX_green <- GO_results_DOX[GO_results_DOX$Module == "lightyellow", ]

GO_results_DOX_green_sorted <- GO_results_DOX_green[order(GO_results_DOX_green$p.adj.log), ]

GO_results_DOX_green_sorted$Description <-factor(GO_results_DOX_green_sorted$Description, levels = rev(GO_results_DOX_green_sorted$Description))


# Plotting
 ggplot(GO_results_DOX_green_sorted, aes(x = Description, y = p.adj.log, fill = Module)) +
  geom_bar(stat = "identity") +
  labs(title = "",
       x = "",
       y = "-log-adj. pval") +
  theme_dark() +
  theme(axis.text.x = element_text(angle = 45, hjust = 1))+
   scale_fill_identity()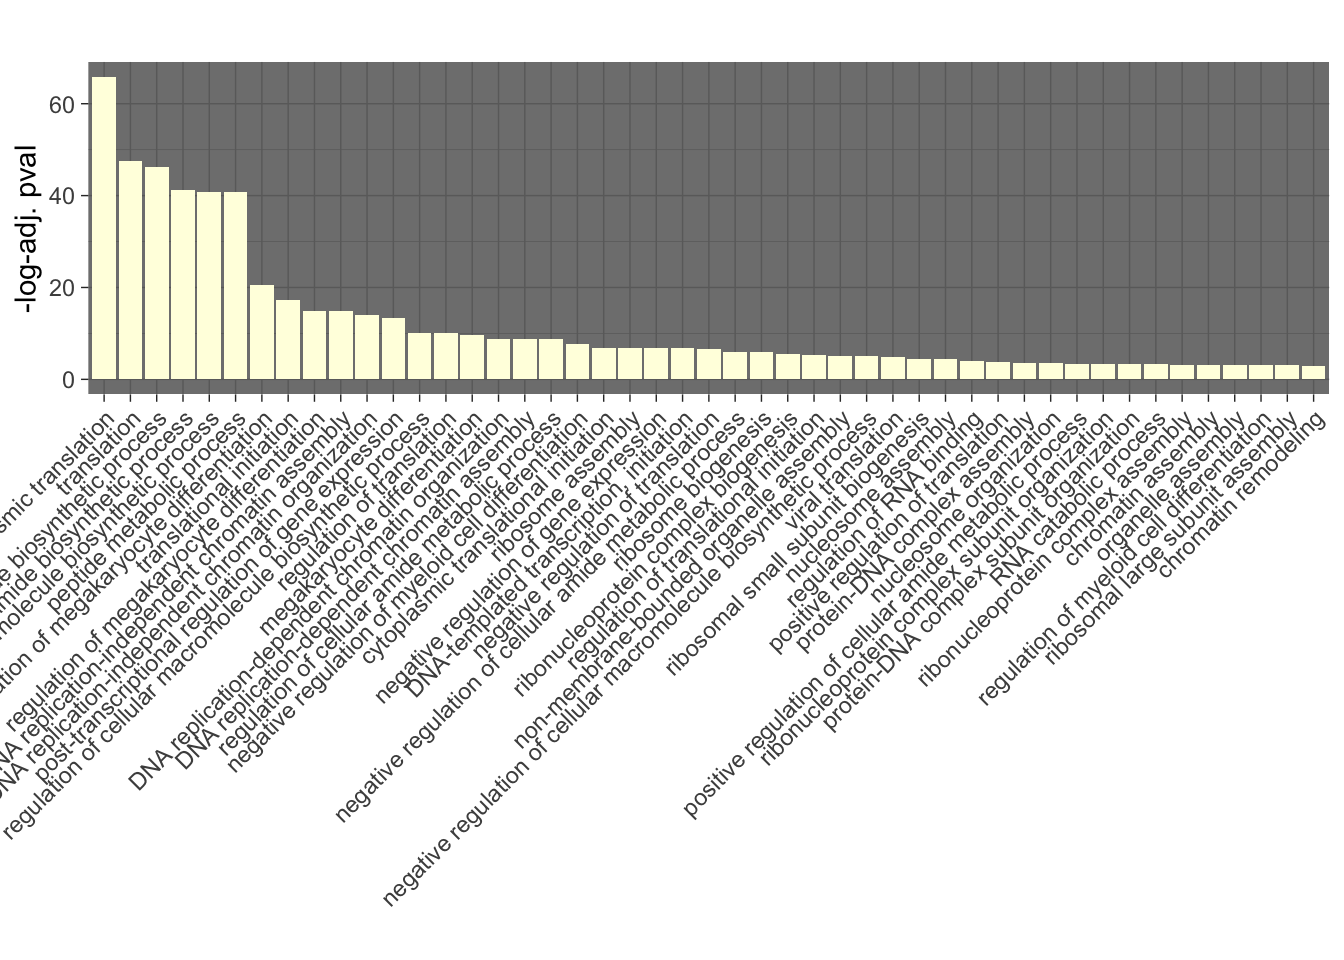
| Version | Author | Date |
|---|---|---|
| 50450f1 | Omar-Johnson | 2024-07-23 |
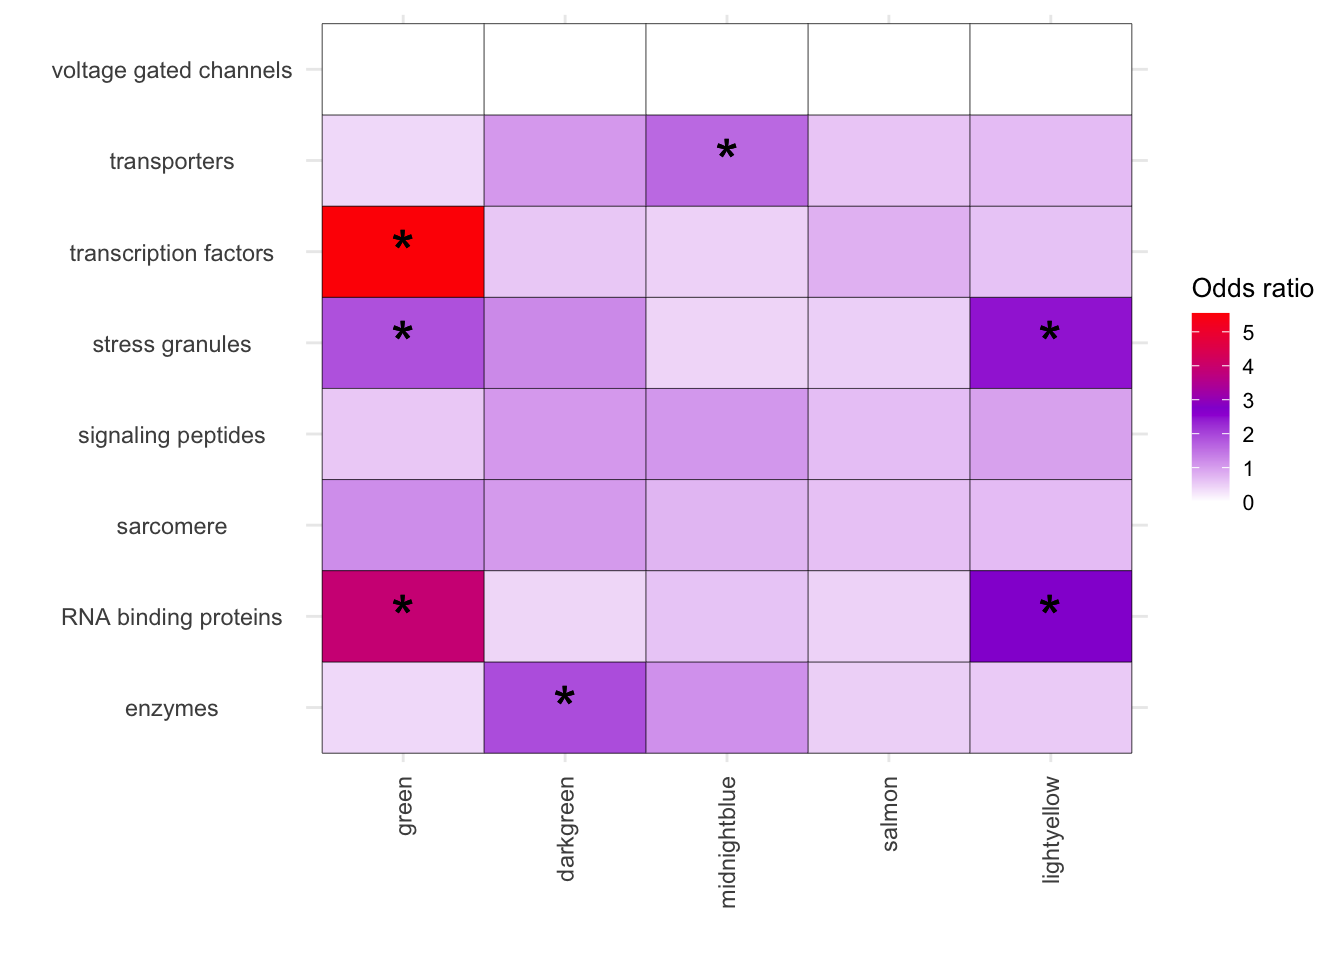
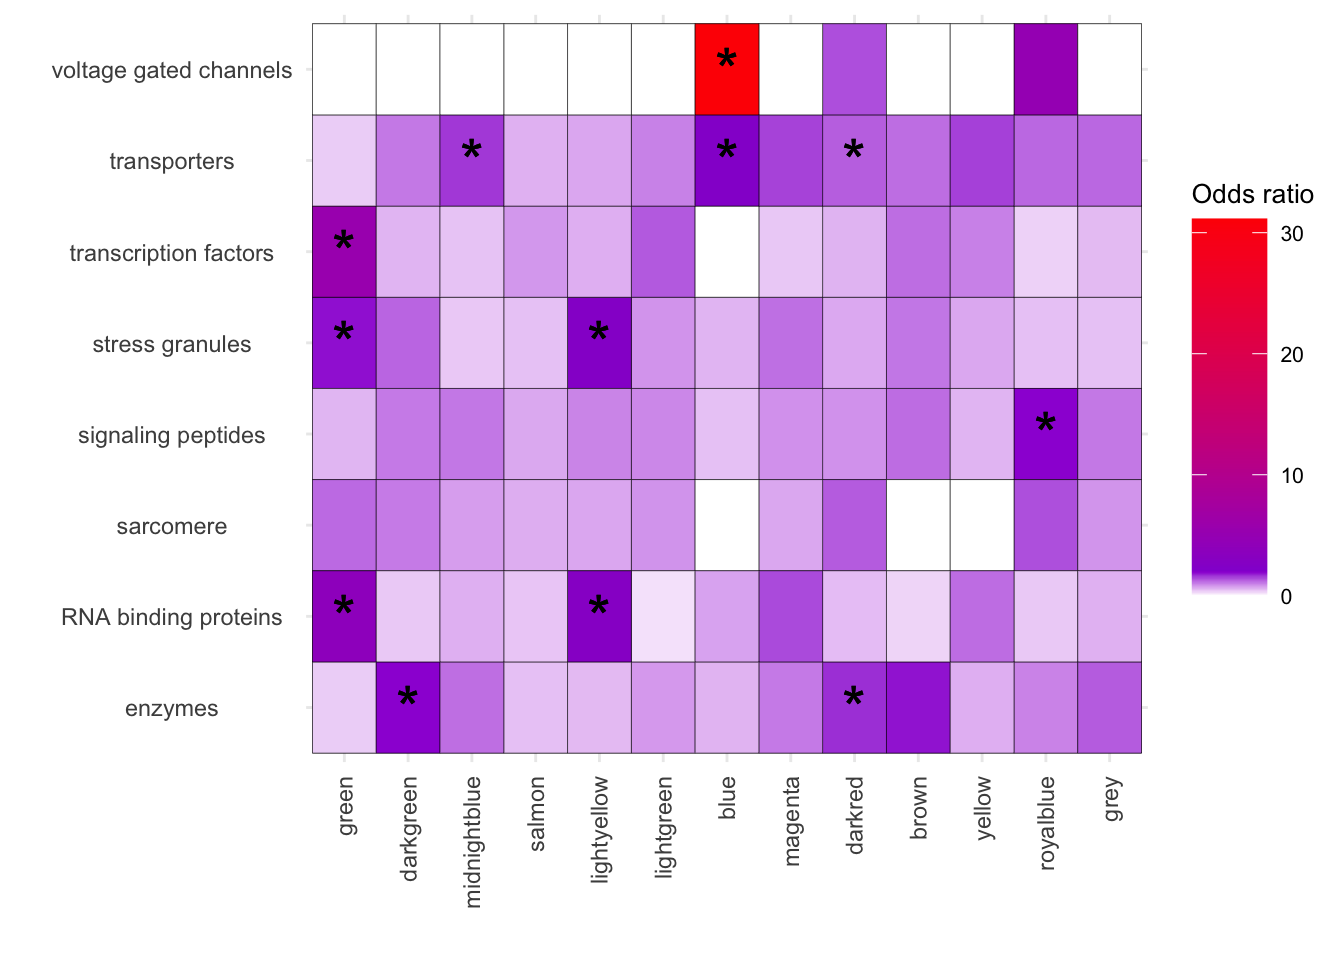
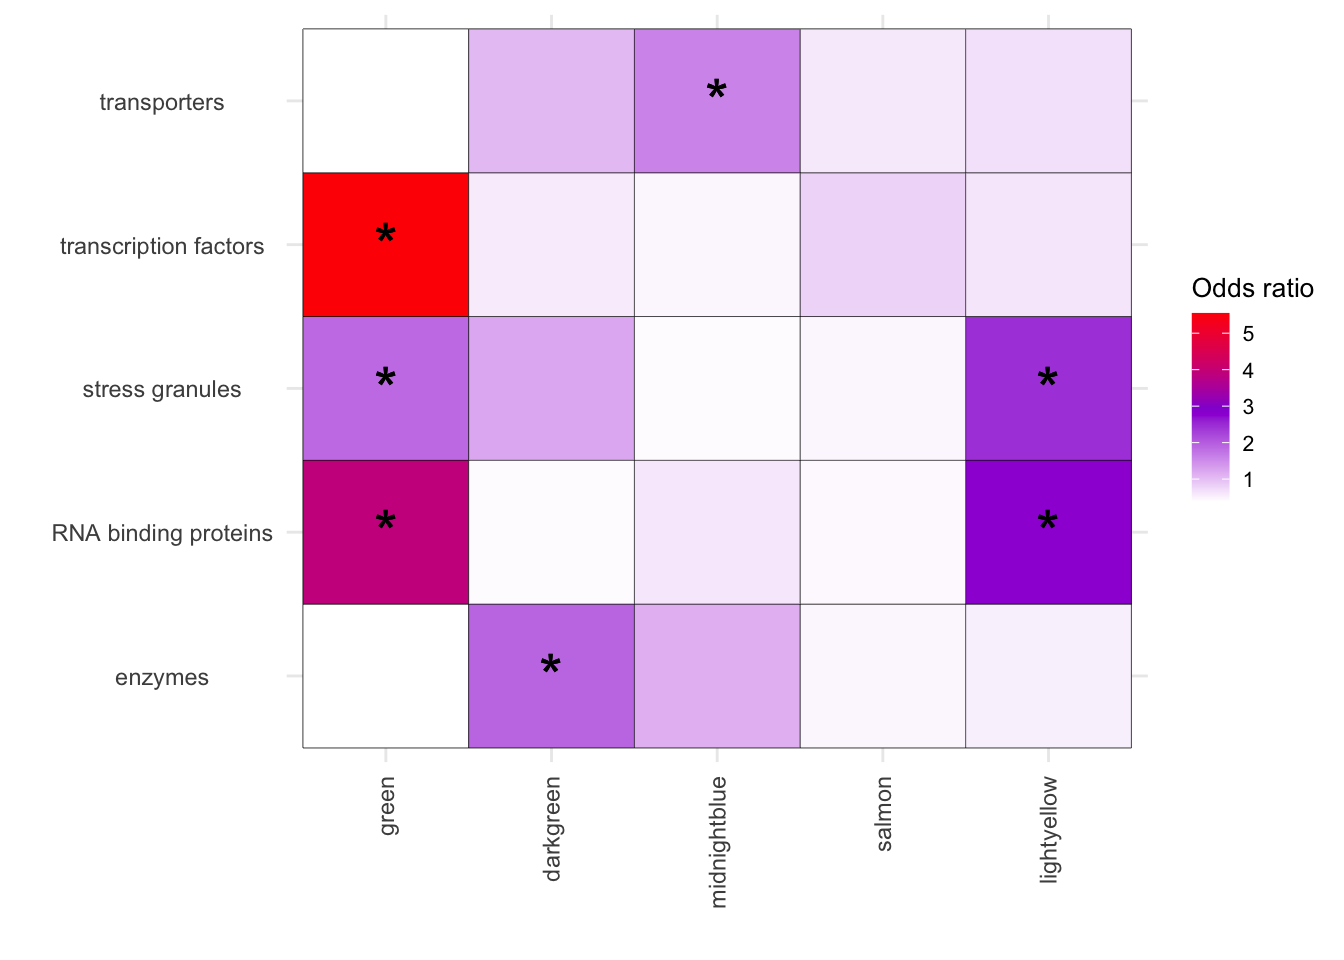
Fig-4B Enriched protein categories
#### Main heatmap ####
# Plot results
results_df <- perform_module_disease_analysis_2(toptable = Toptable_Modules, diseaseGenes = HPA_General3)


melted_results <- melt(results_df, id.vars = c("Modules", "Disease", "PercentOverlap", "FisherPValue","OddsRatio" ))


# First, create a new column that indicates where to place stars
melted_results$Star <- ifelse(melted_results$FisherPValue < 0.05 & melted_results$OddsRatio > 1, "*", "")


melted_results_2 <- melted_results
melted_results_2 <- melted_results
module_order <- c("green","darkgreen","midnightblue","salmon","lightyellow", "lightgreen","blue", "magenta","darkred", "brown", "yellow", "royalblue", "grey")

# Factor the Module column in Fulltrait_df
melted_results_2$Modules <- factor(melted_results_2$Modules, levels = module_order)

melted_results_3 <- melted_results_2[melted_results_2$Modules %in% c("green", "darkgreen", "midnightblue", "salmon","lightyellow"), ]

# Vertical
ggplot(melted_results_3, aes(x = Modules, y = Disease, fill = OddsRatio)) +
  geom_tile(color = "black") +
  scale_fill_gradientn(colors = c("white", "darkviolet", "red"),
                       values = scales::rescale(c(0, 3, 6)),
                       na.value = "grey50", name = "Odds ratio") +
  geom_text(aes(label = Star), color = "black", size = 8, na.rm = TRUE) +
  labs(x = "", y = "") +
  theme_minimal() +
  theme(
    axis.text.x = element_text(angle = 90, vjust = 0.5, hjust = 1),
    axis.text.y = element_text(hjust = 0.5),
    axis.title = element_text(size = 12),
    legend.key.size = unit(0.5, 'cm'),
    legend.title = element_text(size = 10),
    legend.text = element_text(size = 8)
  )
| Version | Author | Date |
|---|---|---|
| 50450f1 | Omar-Johnson | 2024-07-23 |
# Subsetting the graph
ggplot(melted_results_2, aes(x = Modules, y = Disease, fill = OddsRatio)) +
  geom_tile(color = "black") +
  scale_fill_gradientn(colors = c("white", "darkviolet", "red"),
                       values = scales::rescale(c(0, 2, 30)),
                       na.value = "grey50", name = "Odds ratio") +
  geom_text(aes(label = Star), color = "black", size = 8, na.rm = TRUE) +
  labs(x = "", y = "") +
  theme_minimal() +
  theme(
    axis.text.x = element_text(angle = 90, vjust = 0.5, hjust = 1),
    axis.text.y = element_text(hjust = 0.5),
    axis.title = element_text(size = 12),
    legend.key.size = unit(1, 'cm'),
    legend.title = element_text(size = 10),
    legend.text = element_text(size = 8)
  )
| Version | Author | Date |
|---|---|---|
| 50450f1 | Omar-Johnson | 2024-07-23 |
melted_results_3_sub <- melted_results_3[melted_results_3$Disease %in% c("transporters", "transcription factors", "stress granules", "RNA binding proteins", "enzymes"), ]


ggplot(melted_results_3_sub, aes(x = Modules, y = Disease, fill = OddsRatio)) +
  geom_tile(color = "black") +
  scale_fill_gradientn(colors = c("white", "darkviolet", "red"),
                       values = scales::rescale(c(0, 3, 6)),
                       na.value = "grey50", name = "Odds ratio") +
  geom_text(aes(label = Star), color = "black", size = 8, na.rm = TRUE) +
  labs(x = "", y = "") +
  theme_minimal() +
  theme(
    axis.text.x = element_text(angle = 90, vjust = 0.5, hjust = 1),
    axis.text.y = element_text(hjust = 0.5),
    axis.title = element_text(size = 12),
    legend.key.size = unit(0.5, 'cm'),
    legend.title = element_text(size = 10),
    legend.text = element_text(size = 8)
  )
| Version | Author | Date |
|---|---|---|
| 50450f1 | Omar-Johnson | 2024-07-23 |
#### Barplots ####
Combined_for_barplots <- HPA_General3
Combined_for_barplots$RBPs <-HPA_General4_test$`All RBP types`
Combined_for_barplots$TFs <-TF_UNIPROT_ENSEMBL_2_2$uniprotswissprot


# Get resultsdf:
results_df <- perform_module_disease_analysis_2(toptable = Toptable_Modules, diseaseGenes = Combined_for_barplots)


# TFs:
results_df_DOXcorr <- results_df[results_df$Modules %in% c("green"), ]

results_df_DOXcorr_trans <- results_df_DOXcorr[results_df_DOXcorr$Disease == "TFs", ]


results_df_DOXcorr_Secreted <- c(strsplit(results_df_DOXcorr_trans$IntersectingGenes, ";")) %>% unlist()


results_df_DOXcorr_Secreted_hub <- results_df_DOXcorr_Secreted

TF_Dataforplot <- New_RNA_PRO_DF_3[New_RNA_PRO_DF_3$Protein %in% results_df_DOXcorr_Secreted_hub, ]


# Order the data frame by the absolute values of logFC in descending order
TF_Dataforplot_ordered <- TF_Dataforplot[order(-abs(TF_Dataforplot$logFC)), ]

# Subset the top 20 rows
TF_Dataforplot_top_20 <- head(TF_Dataforplot_ordered, 20)

# ------ Adjusted code for barplot for transcription factors
# Order the data frame by the absolute values of logFC in descending order
TF_Dataforplot_ordered <- TF_Dataforplot[order(-abs(TF_Dataforplot$Pro_LogFC)), ]

# Subset the top 20 rows
TF_Dataforplot_top_20 <- head(TF_Dataforplot_ordered, 20)

# Reorder hgnc_symbol based on Pro_LogFC
TF_Dataforplot_top_20$hgnc_symbol <- factor(TF_Dataforplot_top_20$hgnc_symbol,
                                            levels = TF_Dataforplot_top_20$hgnc_symbol[order(TF_Dataforplot_top_20$Pro_LogFC)])

# Plot
ggplot(TF_Dataforplot_top_20, aes(x = hgnc_symbol, y = Pro_LogFC, fill = Modules)) +
  geom_bar(stat = "identity") +
  labs(
    y = "logFC",
    fill = "Modules"
  ) +
  theme_classic() +
  theme(axis.text.x = element_text(angle = 45, hjust = 1)) +
  scale_fill_identity() +
  ylim(c(-3.5, 3.5))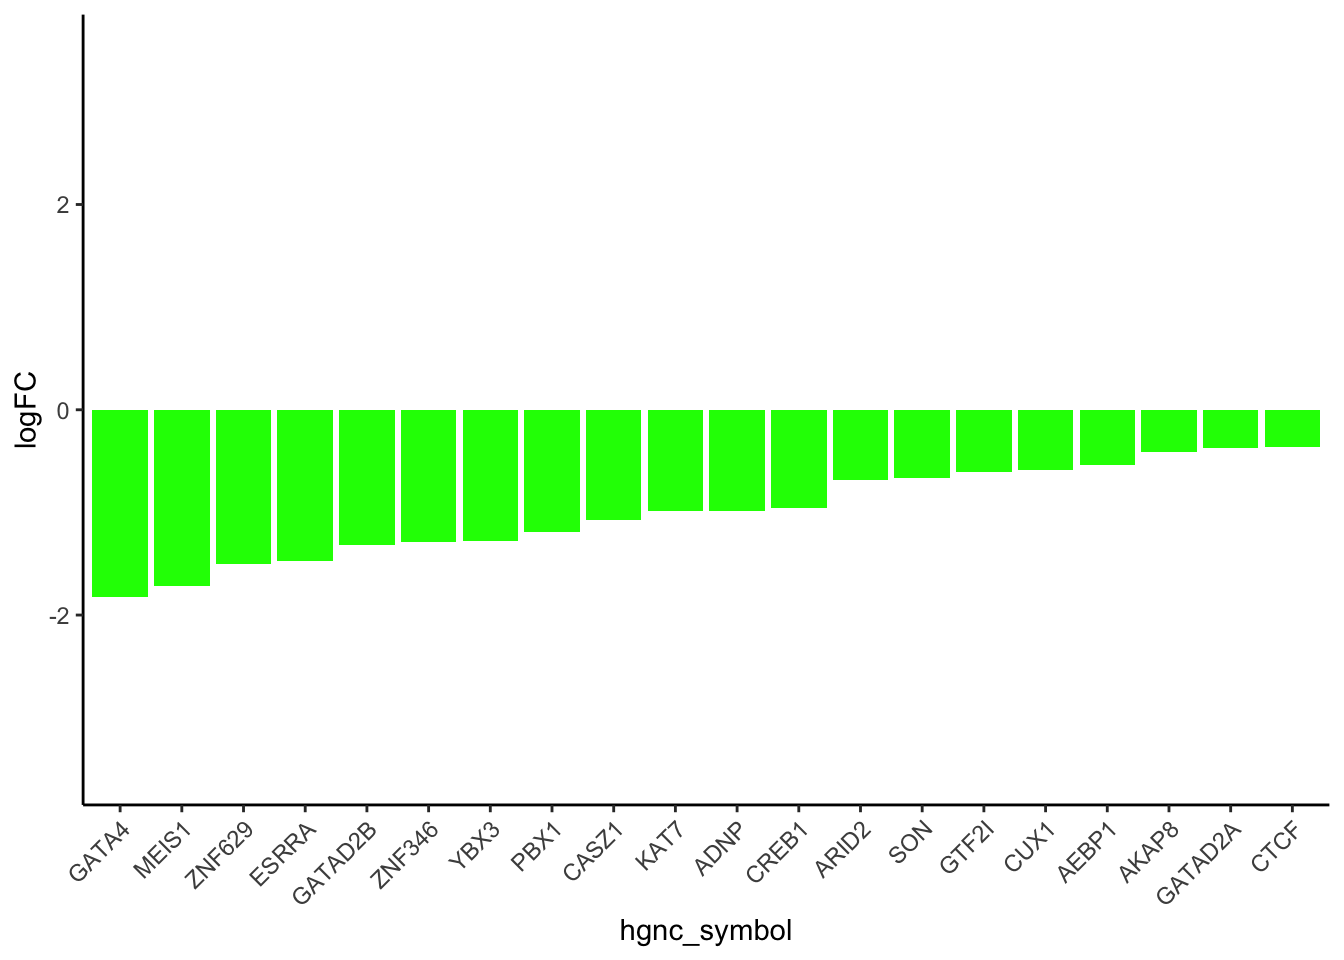
| Version | Author | Date |
|---|---|---|
| 50450f1 | Omar-Johnson | 2024-07-23 |
HPA_General4_test <-HPA_General2_test

# RBPs:
Combined_for_barplots$RBPs <- HPA_General4_test$`All RBP types`
results_df$Disease %>% unique()
[1] "stress granules" "signaling peptides" "transcription factors"
[4] "transporters" "voltage gated channels" "sarcomere"
[7] "enzymes" "RNA binding proteins" "RBPs"
[10] "TFs" results_df_DOXcorr <- results_df[results_df$Modules %in% c("green", "lightyellow"), ]
results_df_DOXcorr_trans <- results_df_DOXcorr[results_df_DOXcorr$Disease == "RBPs", ]
results_df_DOXcorr_trans Modules Disease ChiSqPValue FisherPValue OddsRatio
green_RBPs green RBPs 5.868334e-25 6.720411e-20 3.904224
lightyellow_RBPs lightyellow RBPs 7.511125e-11 4.192718e-09 2.752140
PercentOverlap
green_RBPs 35.68627
lightyellow_RBPs 22.74510
IntersectingGenes
green_RBPs O00541;O14979;O43172;O43251;O43823;O60506;O75940;O94906;O95104;O95453;O95793;P06748;P09012;P14866;P16989;P17844;P26368;P26599;P31483;P49756;P52272;P55265;P55795;P61978;Q00839;Q01081;Q01085;Q01130;Q05519;Q06265;Q07666;Q07955;Q12849;Q12874;Q12905;Q12906;Q13148;Q13151;Q13243;Q13283;Q13427;Q14011;Q14103;Q14498;Q14789;Q15233;Q15365;Q15366;Q15424;Q15637;Q15654;Q4G0J3;Q5BKZ1;Q6P2Q9;Q6UN15;Q7L2E3;Q86U42;Q86XP3;Q8IX01;Q8N163;Q8N684;Q8WUA2;Q8WVV9;Q8WXF1;Q92667;Q92879;Q92900;Q92945;Q96AE4;Q96I24;Q96I25;Q96PK6;Q96PU8;Q99700;Q9BUJ2;Q9BVP2;Q9BWF3;Q9BWU0;Q9BX46;Q9BXY0;Q9H0D6;Q9H307;Q9NQT4;Q9NR30;Q9NUL3;Q9NVV4;Q9NWH9;Q9NYY8;Q9NZB2;Q9UHX1;Q9Y520
lightyellow_RBPs O00571;O15371;O15372;O75533;O75821;P05388;P11940;P15880;P20042;P22626;P23246;P23396;P23588;P26196;P33240;P35637;P38919;P39019;P43243;P46782;P46783;P51114;P51116;P57721;P61247;P61326;P62280;P62847;P63244;P68036;Q04637;Q12972;Q13310;Q13825;Q14151;Q14152;Q14240;Q14671;Q17RY0;Q53R41;Q6PKG0;Q71RC2;Q7KZF4;Q7Z417;Q7Z478;Q8IWS0;Q8IZH2;Q8NC51;Q96DH6;Q9GZR7;Q9HAV4;Q9NUL7;Q9NVU7;Q9UKM9;Q9UN86;Q9Y3A5;Q9Y4Z0;Q9Y6M1results_df_DOXcorr_Secreted <- c(strsplit(results_df_DOXcorr_trans$IntersectingGenes, ";")[[1]],
strsplit(results_df_DOXcorr_trans$IntersectingGenes, ";")[[2]])
results_df_DOXcorr_Secreted_hub <- results_df_DOXcorr_Secreted
TF_Dataforplot <- New_RNA_PRO_DF_3[New_RNA_PRO_DF_3$Protein %in% results_df_DOXcorr_Secreted_hub, ]
# Order the data frame by the absolute values of logFC in descending order
TF_Dataforplot_ordered <- TF_Dataforplot[order(-abs(TF_Dataforplot$logFC)), ]
# Subset the top 20 rows
TF_Dataforplot_top_20 <- head(TF_Dataforplot_ordered, 20)
# ------ Adjusted code for barplot for transcription factors
# Order the data frame by the absolute values of logFC in descending order
TF_Dataforplot_ordered <- TF_Dataforplot[order(-abs(TF_Dataforplot$Pro_LogFC)), ]
# Subset the top 20 rows
TF_Dataforplot_top_20 <- head(TF_Dataforplot_ordered, 20)
# Reorder hgnc_symbol based on Pro_LogFC
TF_Dataforplot_top_20$hgnc_symbol <- factor(TF_Dataforplot_top_20$hgnc_symbol,
levels = TF_Dataforplot_top_20$hgnc_symbol[order(TF_Dataforplot_top_20$Pro_LogFC)])
# Plot
ggplot(TF_Dataforplot_top_20, aes(x = hgnc_symbol, y = Pro_LogFC, fill = Modules)) +
geom_bar(stat = "identity") +
labs(
y = "logFC",
fill = "Modules"
) +
theme_classic() +
theme(axis.text.x = element_text(angle = 45, hjust = 1)) +
scale_fill_identity() +
ylim(c(-3.5, 3.5))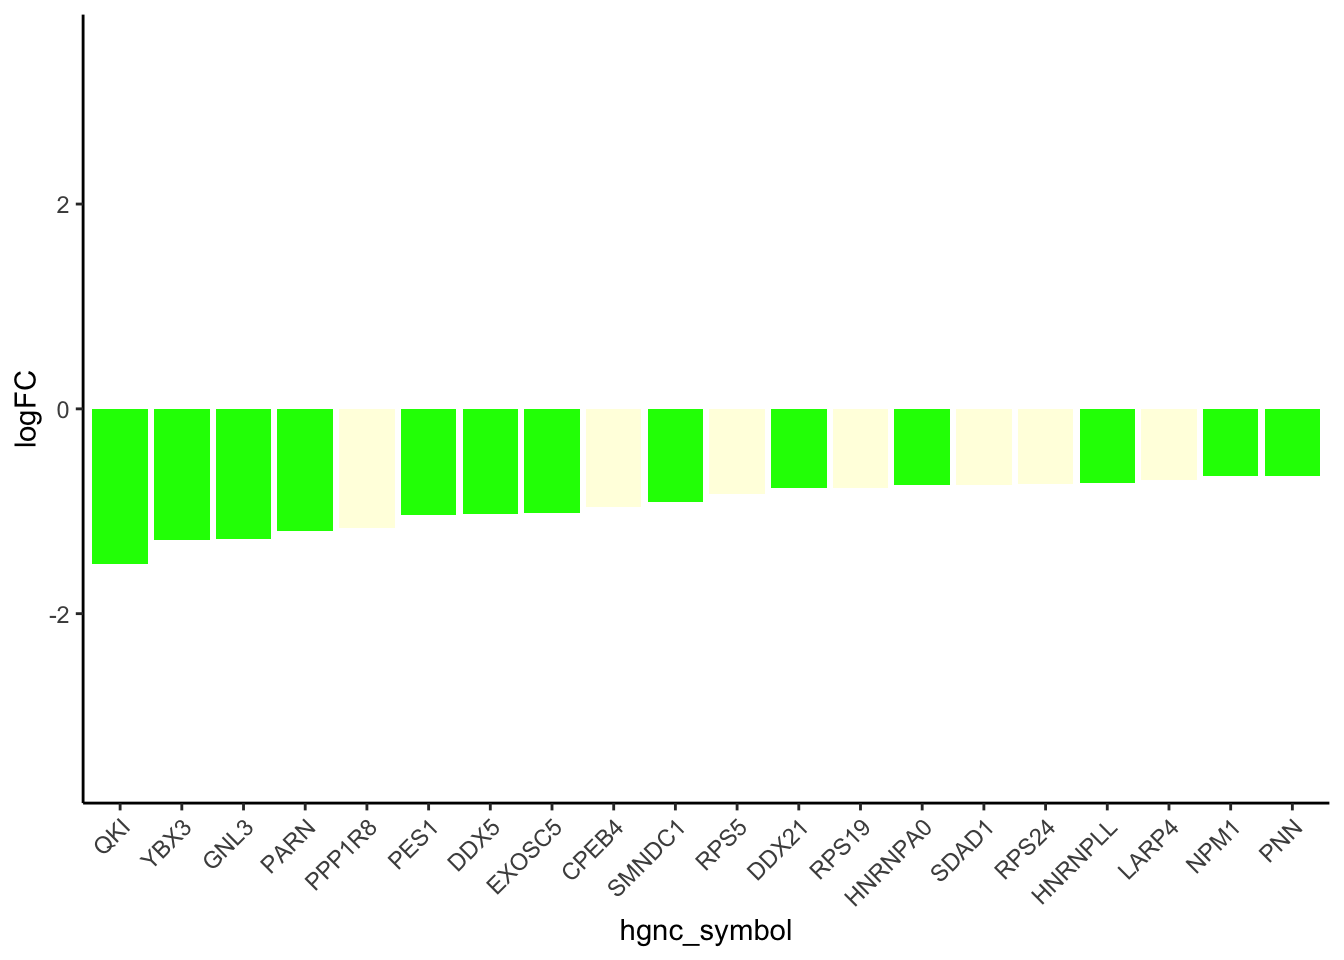
| Version | Author | Date |
|---|---|---|
| 50450f1 | Omar-Johnson | 2024-07-23 |
# ENZYMES:
results_df_DOXcorr <- results_df[results_df$Modules %in% c("darkgreen", "salmon"), ]

results_df_DOXcorr$Disease
[1] "stress granules" "signaling peptides" "transcription factors"
[4] "transporters" "voltage gated channels" "sarcomere"
[7] "enzymes" "RNA binding proteins" "RBPs"
[10] "TFs" "stress granules" "signaling peptides"
[13] "transcription factors" "transporters" "voltage gated channels"
[16] "sarcomere" "enzymes" "RNA binding proteins"
[19] "RBPs" "TFs" results_df_DOXcorr_trans <- results_df_DOXcorr[results_df_DOXcorr$Disease == "enzymes", ]
results_df_DOXcorr_Secreted <- c(strsplit(results_df_DOXcorr_trans$IntersectingGenes, ";")[[1]],
strsplit(results_df_DOXcorr_trans$IntersectingGenes, ";")[[2]])
results_df_DOXcorr_Secreted_hub <- results_df_DOXcorr_Secreted
TF_Dataforplot <- New_RNA_PRO_DF_3[New_RNA_PRO_DF_3$Protein %in% results_df_DOXcorr_Secreted_hub, ]
# Order the data frame by the absolute values of logFC in descending order
TF_Dataforplot_ordered <- TF_Dataforplot[order(-abs(TF_Dataforplot$logFC)), ]
# Subset the top 20 rows
TF_Dataforplot_top_20 <- head(TF_Dataforplot_ordered, 20)
# ------ Adjusted code for barplot for transcription factors
# Order the data frame by the absolute values of logFC in descending order
TF_Dataforplot_ordered <- TF_Dataforplot[order(-abs(TF_Dataforplot$Pro_LogFC)), ]
# Subset the top 20 rows
TF_Dataforplot_top_20 <- head(TF_Dataforplot_ordered, 20)
# Reorder hgnc_symbol based on Pro_LogFC
TF_Dataforplot_top_20$hgnc_symbol <- factor(TF_Dataforplot_top_20$hgnc_symbol,
levels = TF_Dataforplot_top_20$hgnc_symbol[order(TF_Dataforplot_top_20$Pro_LogFC)])
# Plot for all enzymes
ggplot(TF_Dataforplot_top_20, aes(x = hgnc_symbol, y = Pro_LogFC, fill = Modules)) +
geom_bar(stat = "identity") +
labs(
y = "logFC",
fill = "Modules"
) +
theme_classic() +
theme(axis.text.x = element_text(angle = 45, hjust = 1)) +
scale_fill_identity() +
ylim(c(-3.5, 3.5))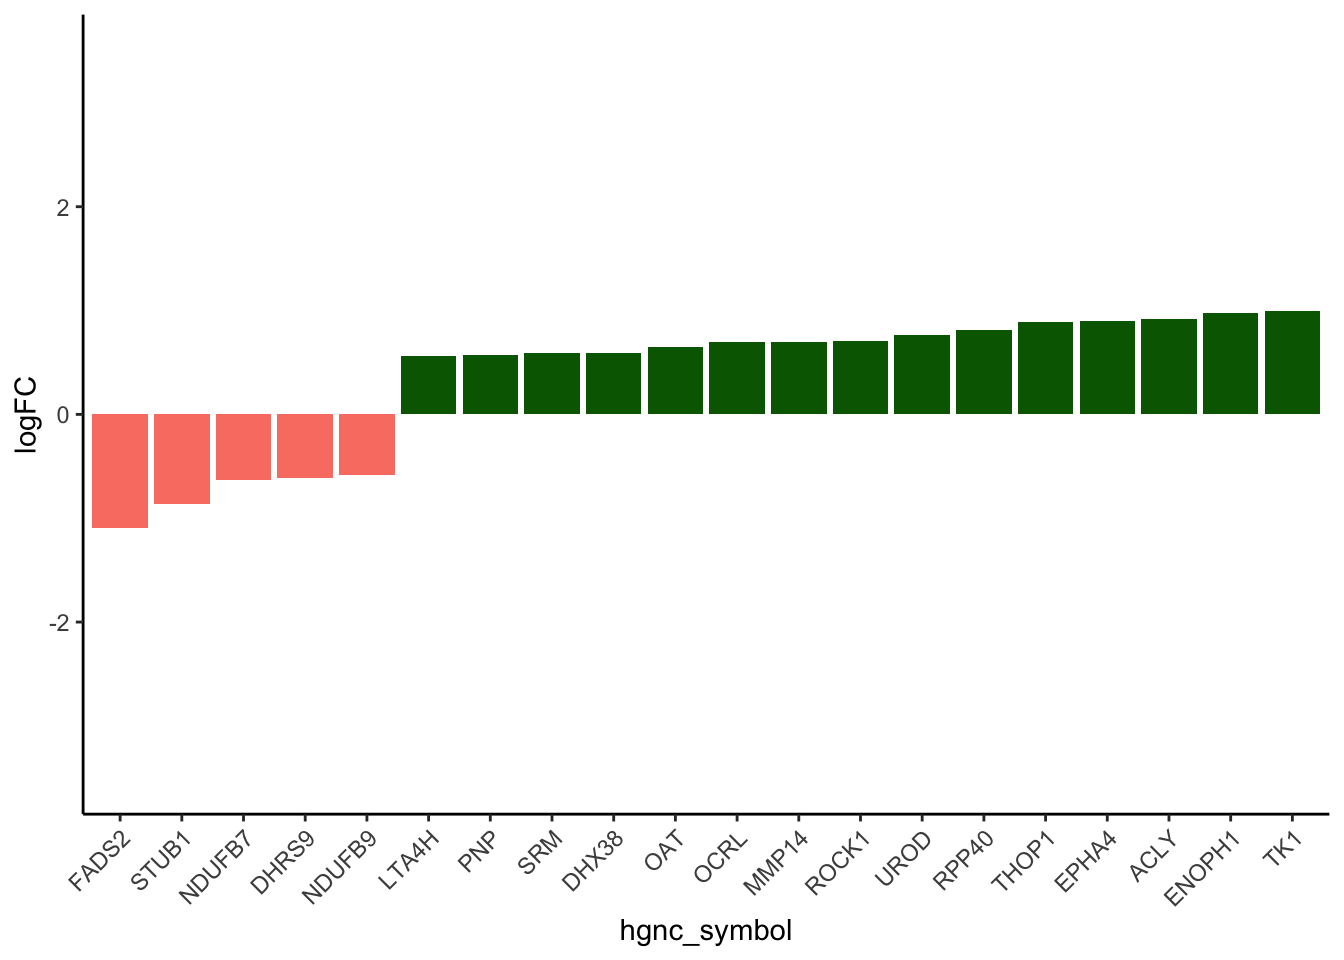
| Version | Author | Date |
|---|---|---|
| 50450f1 | Omar-Johnson | 2024-07-23 |
TF_Dataforplot_top_20 %>% dim()[1] 20 44Fig-4C Enriched TF categories
#### Heatmap ####
# Plot results
results_df <- perform_module_disease_analysis_2(toptable = Toptable_Modules, diseaseGenes = dbd_uniprot_list_test)


results_df[(results_df$FisherPValue < 0.05) & (results_df$Modules %in% c("green","darkgreen","midnightblue","salmon","lightyellow")), ]
Modules Disease ChiSqPValue FisherPValue OddsRatio
green_C2H2 ZF green C2H2 ZF NA 0.0004475495 5.663042
green_GATA green GATA NA 0.0026496519 Inf
green_Homeodomain green Homeodomain NA 0.0043440227 12.498067
PercentOverlap
green_C2H2 ZF 47.36842
green_GATA 100.00000
green_Homeodomain 66.66667
IntersectingGenes
green_C2H2 ZF O43823;O95251;P49711;Q5BKZ1;Q86V15;Q92784;Q96ME7;Q9UEG4;Q9UL40
green_GATA P43694;Q86YP4;Q8WXI9
green_Homeodomain O00470;P39880;P40424;Q9H2P0melted_results <- melt(results_df, id.vars = c("Modules", "Disease", "PercentOverlap", "FisherPValue","OddsRatio" ))
# First, create a new column that indicates where to place stars
melted_results$Star <- ifelse(melted_results$FisherPValue < 0.05 & melted_results$OddsRatio > 1, "*", "")
melted_results_2 <- melted_results
melted_results_2 <- melted_results
module_order <- c("green","darkgreen","midnightblue","salmon","lightyellow", "lightgreen","blue", "magenta","darkred", "brown", "yellow", "royalblue", "grey")
# Factor the Module column in Fulltrait_df
melted_results_2$Modules <- factor(melted_results_2$Modules, levels = module_order)
melted_results_3 <- melted_results_2
melted_results_4 <- melted_results_3[melted_results_3$Modules %in% c("green", "darkgreen", "midnightblue", "salmon", "lightyellow"), ]
melted_results_4$Disease %>% unique() [1] "ARID/BRIGHT" "AT hook" "BED ZF" "bHLH"
[5] "bZIP" "C2H2 ZF" "CBF/NF-Y" "CSD"
[9] "CUT" "CxxC" "CxxC ZF" "Ets"
[13] "GATA" "Grainyhead" "GTF2I-like" "HMG/Sox"
[17] "Homeodomain" "MADS box" "MBD" "Myb/SANT"
[21] "Nuclear receptor" "p53" "Rel" "RFX"
[25] "SMAD" "STAT" "TEA" "Unknown" melted_results_5 <- melted_results_4[melted_results_4$Disease %in% c("Homeodomain","GATA","C2H2 ZF"), ]
ggplot(melted_results_5, aes(x = Modules, y = Disease, fill = OddsRatio)) +
geom_tile(color = "black") +
scale_fill_gradientn(colors = c("white", "darkviolet", "red"),
values = scales::rescale(c(0, 5, 50)),
na.value = "grey50", name = "Odds ratio") +
geom_text(aes(label = Star), color = "black", size = 6, na.rm = TRUE) +
labs(x = "", y = "") +
theme_minimal() +
theme(
axis.text.x = element_text(angle = 90, vjust = 0.5, hjust = 1),
axis.text.y = element_text(hjust = 0.5),
axis.title = element_text(size = 12),
legend.key.size = unit(0.6, 'cm'),
legend.title = element_text(size = 10),
legend.text = element_text(size = 8)
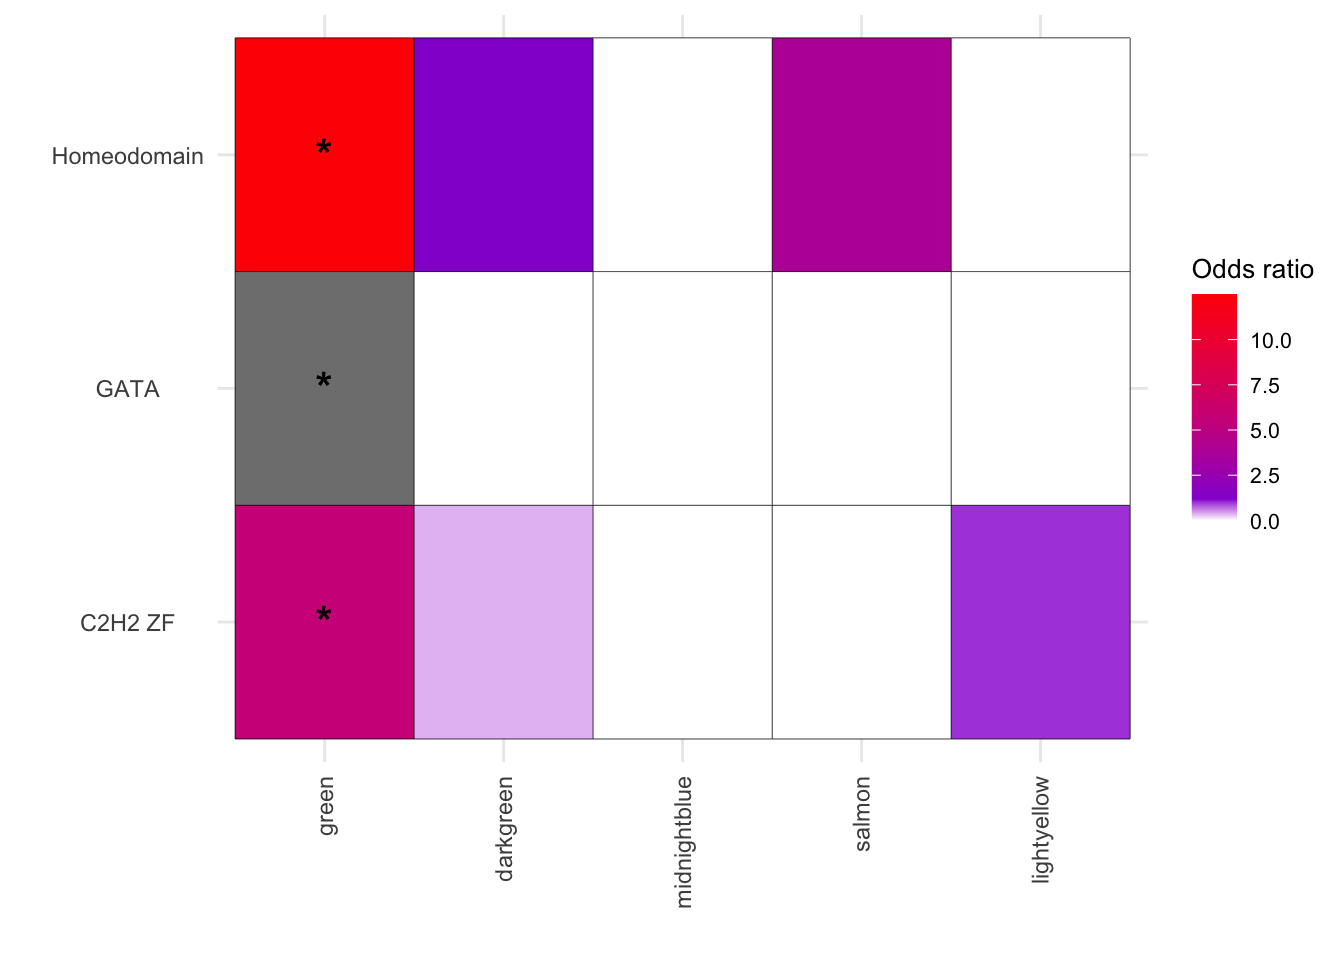
)
| Version | Author | Date |
|---|---|---|
| 50450f1 | Omar-Johnson | 2024-07-23 |
#### Barplots ####
results_df_DOXcorr <- results_df[results_df$Modules == "green", ]


results_df_DOXcorr_Secreted <- strsplit(results_df_DOXcorr$IntersectingGenes, ";") %>% unlist()

results_df_DOXcorr_Secreted_hub <- results_df_DOXcorr_Secreted


ggplot(New_RNA_PRO_DF_3[New_RNA_PRO_DF_3$Protein %in% results_df_DOXcorr_Secreted_hub, ], aes(x = hgnc_symbol, y = Pro_LogFC, fill = Modules)) +
  geom_bar(stat = "identity") +
  labs(
    x = "Protein",
    y = "logFC",
    fill = "Modules",
    title = "DOX corr. transcrption factors"
  ) +
  theme_dark() +
  theme(axis.text.x = element_text(angle = 45, hjust = 1))+
  scale_fill_identity()+
  ylim(c(-3, 3))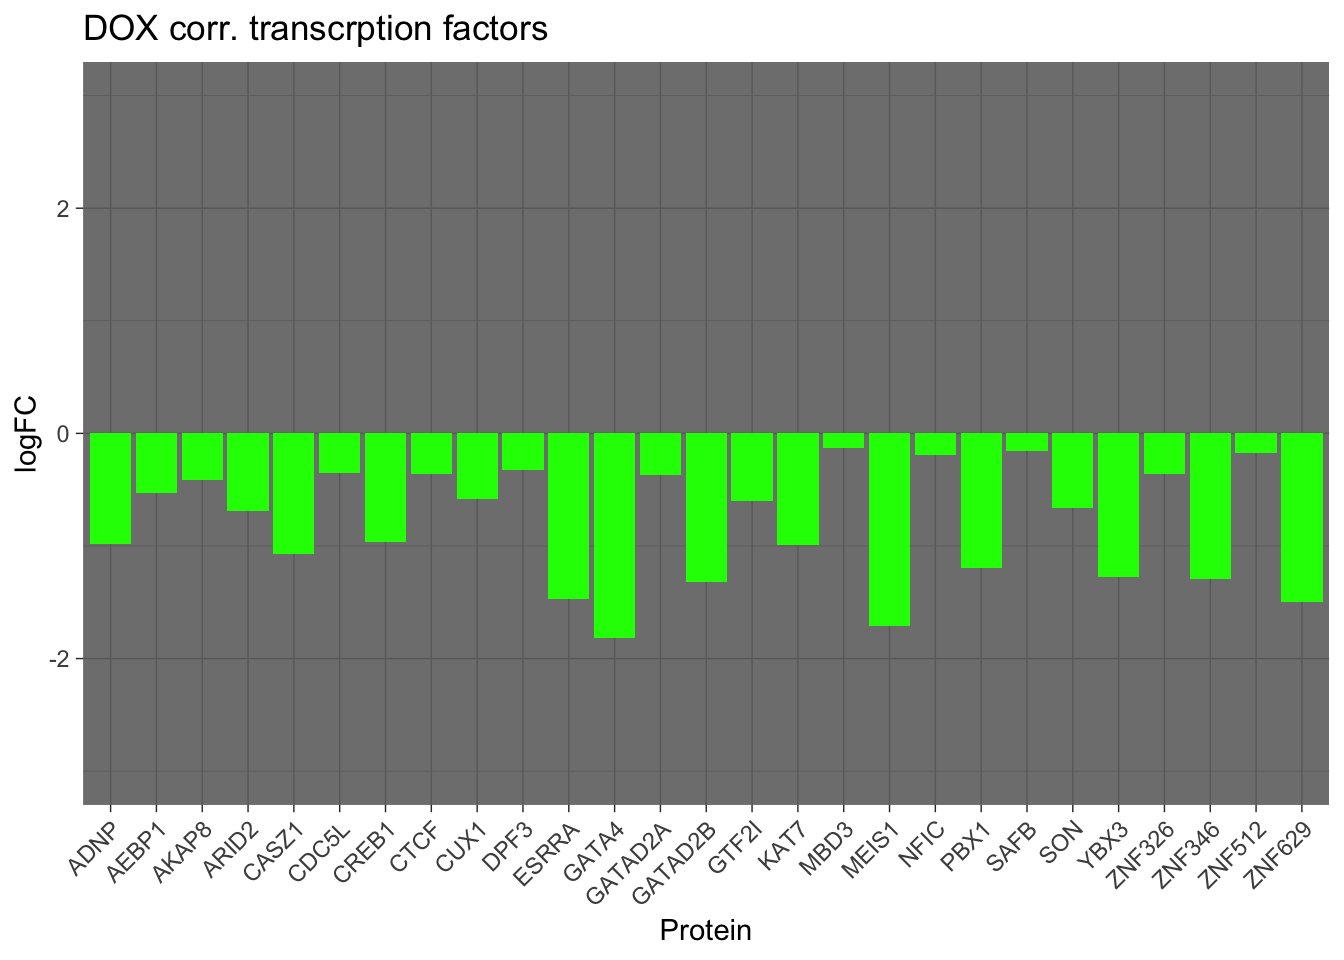
| Version | Author | Date |
|---|---|---|
| 50450f1 | Omar-Johnson | 2024-07-23 |
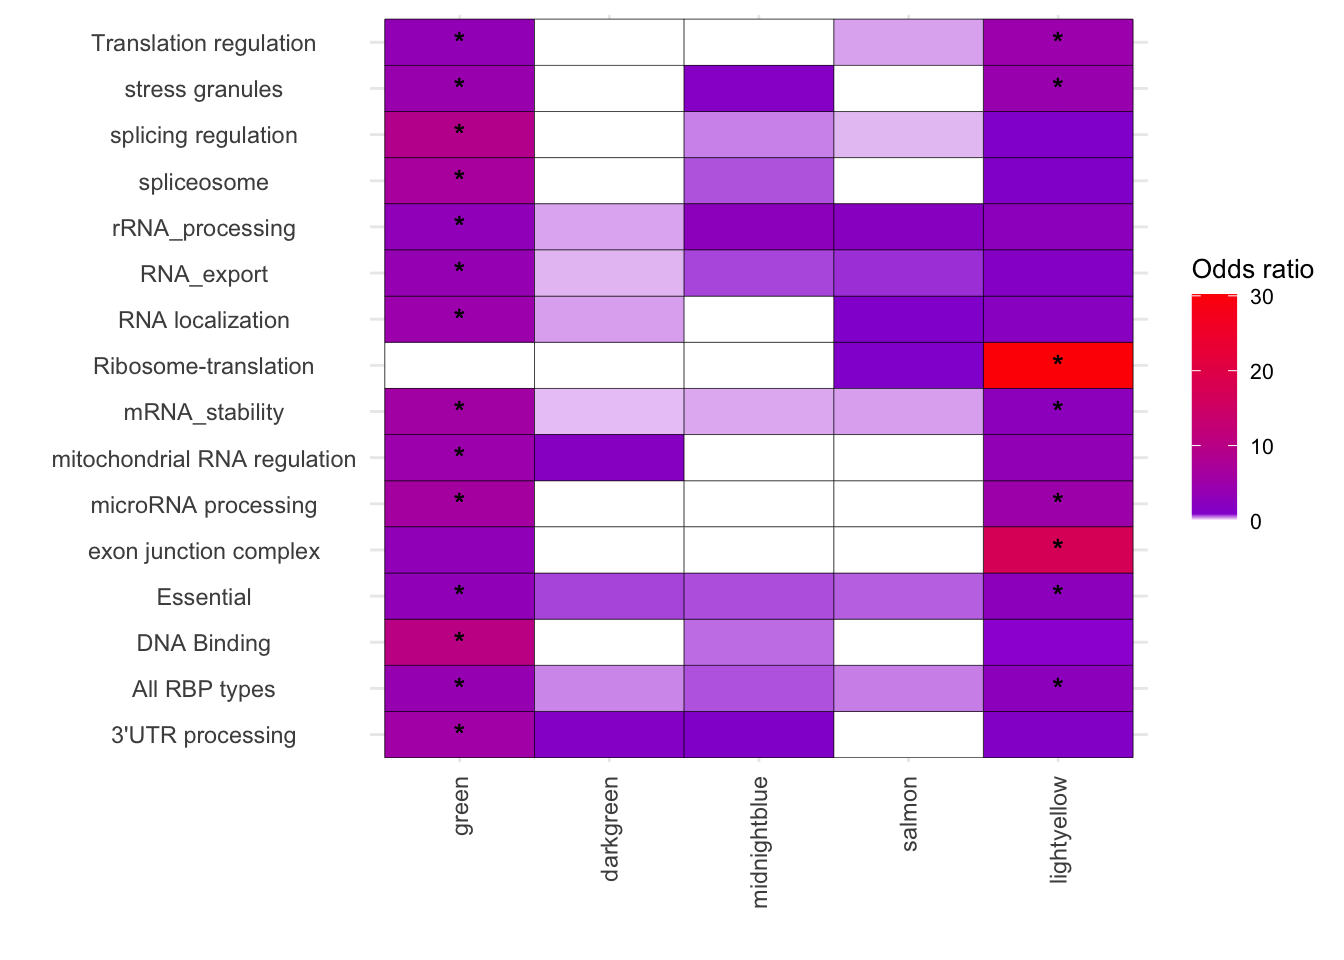
Fig-4D Enriched RBP categories
RBP_pros_uniprot_3 %>% head() X ensembl_gene_id uniprotswissprot hgnc_symbol RBP.name Essential.Genes
1 1 ENSG00000003756 P52756 RBM5 RBM5 1
2 2 ENSG00000004478 Q02790 FKBP4 FKBP4 0
3 3 ENSG00000004534 P78332 RBM6 RBM6 0
4 4 ENSG00000004700 P46063 RECQL RECQL 0
5 5 ENSG00000005007 Q92900 UPF1 UPF1 1
6 6 ENSG00000005100 Q9H6R0 DHX33 DHX33 1
Splicing.regulation Spliceosome RNA.modification X3..end.processing
1 1 1 0 0
2 0 0 0 0
3 1 0 0 0
4 0 0 0 0
5 0 0 0 0
6 0 0 0 0
rRNA.processing Ribosome...basic.translation RNA.stability...decay
1 0 0 0
2 0 0 0
3 0 0 0
4 0 0 0
5 0 0 1
6 0 0 0
microRNA.processing RNA.localization RNA.export Translation.regulation
1 0 0 0 0
2 1 0 0 0
3 0 0 0 0
4 0 0 0 0
5 0 0 1 1
6 0 0 0 1
tRNA.regulation mitochondrial.RNA.regulation Viral.RNA.regulation
1 0 0 0
2 0 0 0
3 0 0 0
4 0 0 0
5 0 0 0
6 0 0 0
snoRNA...snRNA...telomerase P.body...stress.granules Exon.Junction.Complex
1 0 0 0
2 0 0 0
3 0 0 0
4 0 0 0
5 0 0 0
6 0 0 0
Novel.RBP Other Nuclei Nucleolus Speckles PML.bodies Cajal.bodies Cytoplasm
1 0 0 1 0 0 0 0 1
2 0 0 1 0 0 0 0 1
3 0 0 0 0 0 0 0 1
4 1 0 1 0 0 0 0 1
5 0 0 1 0 1 0 0 1
6 0 0 1 1 0 0 0 1
Mitochondria Golgi P.bodies ER Cytoskeleton Microtubule Actin
1 1 0 0 0 0 0 0
2 0 0 0 0 0 0 0
3 0 0 0 0 0 0 0
4 0 0 0 0 0 0 0
5 0 0 1 0 0 0 0
6 0 0 0 0 0 0 0
Nuclear.release.mitosis Cell.Cortex RRM ZNF KH Helicase Nuclease dRBM PUM_HD
1 0 0 1 1 0 0 0 0 0
2 0 0 0 0 0 0 0 0 0
3 0 0 1 0 0 0 0 0 0
4 1 0 0 0 0 1 0 0 0
5 0 0 0 0 0 0 0 0 0
6 0 0 0 0 0 1 0 0 0
eCLIP.HepG1 eCLIP.K561 RNAseq.HepG1 RNAseq.K561 RBNS Image.HepG1
1 1 0 1 0 0 1
2 1 0 1 1 0 1
3 0 0 0 0 1 1
4 0 0 1 1 0 1
5 1 1 1 1 0 1
6 0 0 0 0 0 1
ChIPseq.HepG1 ChIPseq.K561
1 0 0
2 0 0
3 0 0
4 0 0
5 0 0
6 0 0# RBPs all types
HPA_General2_test$RBP_All_types <- RBP_pros_uniprot_3$uniprotswissprot
# RBPs thaat are DNA Binding
HPA_General2_test$RBP_DNA_Binding <-
RBP_pros_uniprot_3[RBP_pros_uniprot_3$ChIPseq.HepG1 == 1|RBP_pros_uniprot_3$ChIPseq.K561 == 1 , ]$uniprotswissprot
# RBPs that are essential
HPA_General2_test$RBP_Essential <- RBP_pros_uniprot_3[RBP_pros_uniprot_3$Essential.Genes == 1, ]$uniprotswissprot
# RBP Splicing.regulation
HPA_General2_test$RBP_Splicing_regulation <- RBP_pros_uniprot_3[RBP_pros_uniprot_3$Splicing.regulation == 1, ]$uniprotswissprot
# RBP spliceosome
HPA_General2_test$RBP_spliceosome <- RBP_pros_uniprot_3[RBP_pros_uniprot_3$Spliceosome == 1, ]$uniprotswissprot
# RBP RNA modifyinig
HPA_General2_test$RBP_RNA_modifynig <- RBP_pros_uniprot_3[RBP_pros_uniprot_3$RNA.modification == 1, ]$uniprotswissprot
# RBP RNA modifyinig
HPA_General2_test$RBP_3UTR_processing <- RBP_pros_uniprot_3[RBP_pros_uniprot_3$X3..end.processing == 1, ]$uniprotswissprot
# RBP RNA modifyinig
HPA_General2_test$RBP_rRNA_processing <- RBP_pros_uniprot_3[RBP_pros_uniprot_3$rRNA.processing == 1, ]$uniprotswissprot
# RBP Ribosome translation
HPA_General2_test$RBP_Ribosome_translation <- RBP_pros_uniprot_3[RBP_pros_uniprot_3$Ribosome...basic.translation == 1, ]$uniprotswissprot
# RBP mRNA_stability
HPA_General2_test$RBP_mRNA_stability <- RBP_pros_uniprot_3[RBP_pros_uniprot_3$RNA.stability...decay == 1, ]$uniprotswissprot
# RBP microRNA_processing
HPA_General2_test$RBP_microRNA_processing <- RBP_pros_uniprot_3[RBP_pros_uniprot_3$microRNA.processing == 1, ]$uniprotswissprot
# RBP RNA.localization
HPA_General2_test$RBP_RNA_localization <- RBP_pros_uniprot_3[RBP_pros_uniprot_3$RNA.localization == 1, ]$uniprotswissprot
# RBP RNA.export
HPA_General2_test$RBP_RNA_export <- RBP_pros_uniprot_3[RBP_pros_uniprot_3$RNA.export == 1, ]$uniprotswissprot
# RBP_Translation_reg
HPA_General2_test$RBP_Translation_reg <- RBP_pros_uniprot_3[RBP_pros_uniprot_3$Translation.regulation == 1, ]$uniprotswissprot
# RBP tRNA.regulation
HPA_General2_test$RBP_tRNA.regulation <- RBP_pros_uniprot_3[RBP_pros_uniprot_3$tRNA.regulation == 1, ]$uniprotswissprot
# RBP_mitochond._RNA_reg
HPA_General2_test$RBP_mitochond._RNA_reg <- RBP_pros_uniprot_3[RBP_pros_uniprot_3$mitochondrial.RNA.regulation == 1, ]$uniprotswissprot
# RBP_Stress_granules
HPA_General2_test$RBP_Stress_granules <- RBP_pros_uniprot_3[RBP_pros_uniprot_3$P.body...stress.granules == 1, ]$uniprotswissprot
# RBP_Exon.Junction.Complex
HPA_General2_test$RBP_Exon.Junction.Complex <- RBP_pros_uniprot_3[RBP_pros_uniprot_3$Exon.Junction.Complex == 1, ]$uniprotswissprot
HPA_General4_test <-HPA_General2_test
HPA_General4_test <- HPA_General2_test[5:length(HPA_General2_test)]
names(HPA_General4_test) <- c("DNA Binding" ,"Essential", "splicing regulation","spliceosome", "RNA_modifynig", "3'UTR processing", "rRNA_processing", "Ribosome-translation", "mRNA_stability", "microRNA processing","RNA localization", "RNA_export", "Translation regulation", "tRNA regulation", "mitochondrial RNA regulation", "stress granules", "exon junction complex", "All RBP types")
results_df <- perform_module_disease_analysis_2(toptable = Toptable_Modules, diseaseGenes = HPA_General4_test)
melted_results <- melt(results_df, id.vars = c("Modules", "Disease", "PercentOverlap", "FisherPValue","OddsRatio" ))
# First, create a new column that indicates where to place stars
melted_results$Star <- ifelse(melted_results$FisherPValue < 0.05 & melted_results$OddsRatio > 1, "*", "")
melted_results_2 <- melted_results
melted_results_2 <- melted_results
module_order <- c("green","darkgreen","midnightblue","salmon","lightyellow", "lightgreen","blue", "magenta","darkred", "brown", "yellow", "royalblue", "grey")
# Factor the Module column in Fulltrait_df
melted_results_2$Modules <- factor(melted_results_2$Modules, levels = module_order)
melted_results_3 <- melted_results_2[melted_results_2$Modules %in% c("green","darkgreen","midnightblue","salmon","lightyellow"), ]
thingstosubset <- melted_results_3[(melted_results_3$FisherPValue< 0.05)& (melted_results_3$OddsRatio > 1), ]$Disease
thingstosubset [1] "DNA Binding" "Essential"
[3] "splicing regulation" "spliceosome"
[5] "3'UTR processing" "rRNA_processing"
[7] "mRNA_stability" "microRNA processing"
[9] "RNA localization" "RNA_export"
[11] "Translation regulation" "mitochondrial RNA regulation"
[13] "stress granules" "All RBP types"
[15] "Essential" "Ribosome-translation"
[17] "mRNA_stability" "microRNA processing"
[19] "Translation regulation" "stress granules"
[21] "exon junction complex" "All RBP types"
[23] "DNA Binding" "Essential"
[25] "splicing regulation" "spliceosome"
[27] "3'UTR processing" "rRNA_processing"
[29] "mRNA_stability" "microRNA processing"
[31] "RNA localization" "RNA_export"
[33] "Translation regulation" "mitochondrial RNA regulation"
[35] "stress granules" "All RBP types"
[37] "Essential" "Ribosome-translation"
[39] "mRNA_stability" "microRNA processing"
[41] "Translation regulation" "stress granules"
[43] "exon junction complex" "All RBP types" melted_results_4 <- melted_results_3[melted_results_3$Disease %in% thingstosubset, ]
# Vertical
ggplot(melted_results_4, aes(x = Modules, y = Disease, fill = OddsRatio)) +
geom_tile(color = "black") +
scale_fill_gradientn(colors = c("white", "darkviolet", "red"),
values = scales::rescale(c(0, 3, 100)),
na.value = "grey50", name = "Odds ratio") +
geom_text(aes(label = Star), color = "black", size = 4, na.rm = TRUE) +
labs(x = "", y = "") +
theme_minimal() +
theme(
axis.text.x = element_text(angle = 90, vjust = 0.5, hjust = 1),
axis.text.y = element_text(hjust = 0.5),
axis.title = element_text(size = 12),
legend.key.size = unit(0.6, 'cm'),
legend.title = element_text(size = 10),
legend.text = element_text(size = 8)
)
| Version | Author | Date |
|---|---|---|
| 50450f1 | Omar-Johnson | 2024-07-23 |
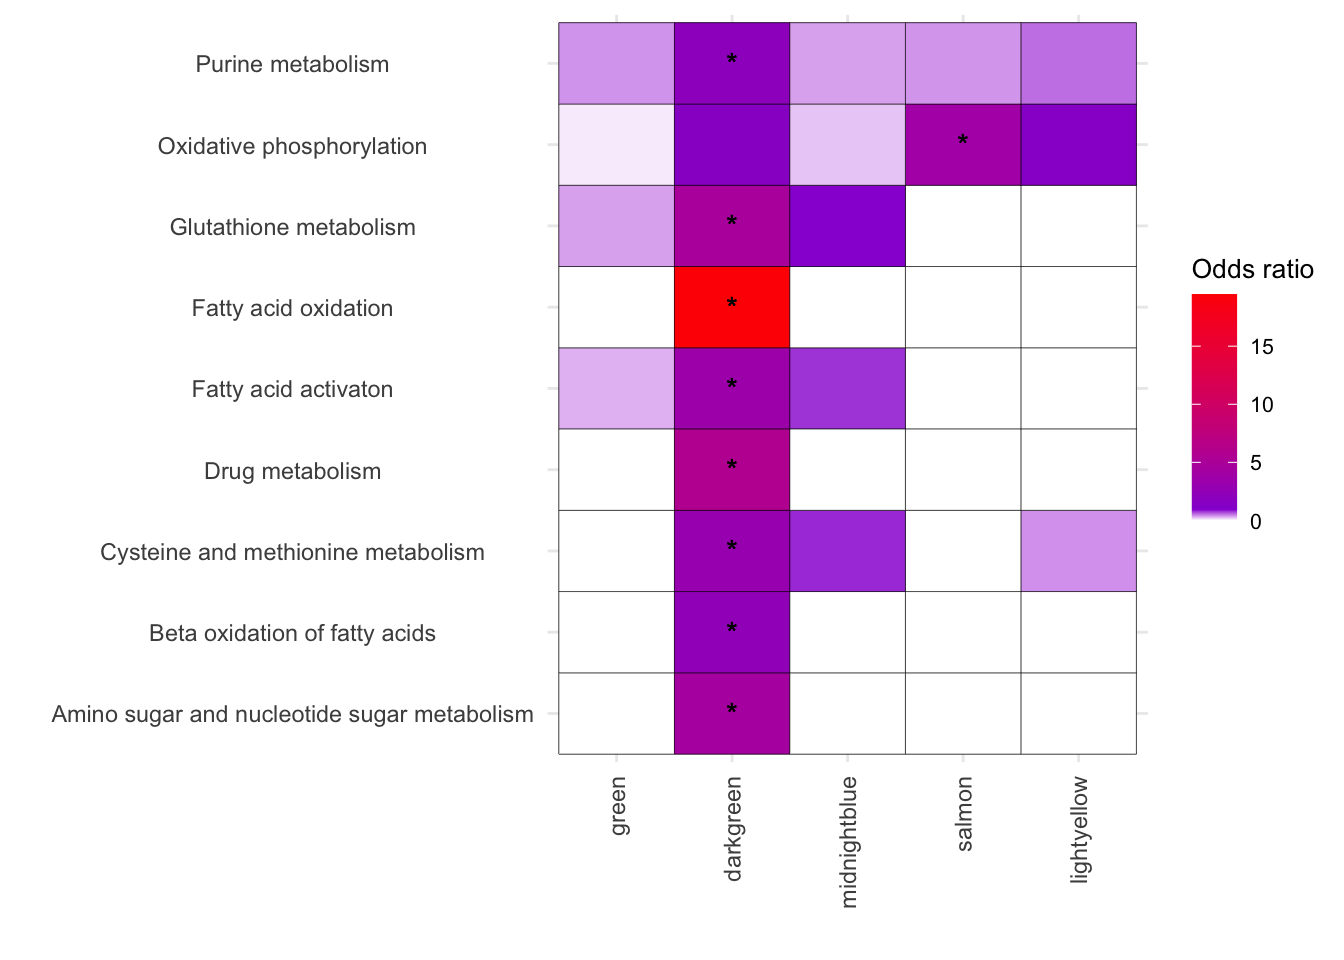
Fig-4E Enriched Enzyme categories
# Get the list of .tsv files
file_names <- list.files(path = folder_path, pattern = "\\.tsv$", full.names = TRUE)


# Read each file and extract the 'Uniprot' column
HPA_Metabo <- lapply(file_names, function(file) {
  data <- read.table(file, header = TRUE, sep = "\t") # for tab-separated values
  return(data$Uniprot) # 'Uniprot' is column name
})


# Name the list elements without the full path and extension
names(HPA_Metabo) <- sapply(strsplit(basename(file_names), "\\."), `[`, 1)
EnzymeClassNamesTosave <- names(HPA_Metabo)


EnzymeTable %>% head()
X x Name
1 1 pathway_Acyl-CoA Acyl-CoA hydrolysis
2 2 pathway_Acylglycerides Acylglycerides metabolism
3 3 pathway_Alanine_ Alanine; aspartate and glutamate metabolism
4 4 pathway_Amino Amino sugar and nucleotide sugar metabolism
5 5 pathway_Aminoacyl-tRNA Aminoacyl-tRNA biosynthesis
6 6 pathway_Androgen Androgen metabolismcolnames(EnzymeTable) <- c("ID", "Filename", "Description")
EnzymeTable %>% head() ID Filename Description
1 1 pathway_Acyl-CoA Acyl-CoA hydrolysis
2 2 pathway_Acylglycerides Acylglycerides metabolism
3 3 pathway_Alanine_ Alanine; aspartate and glutamate metabolism
4 4 pathway_Amino Amino sugar and nucleotide sugar metabolism
5 5 pathway_Aminoacyl-tRNA Aminoacyl-tRNA biosynthesis
6 6 pathway_Androgen Androgen metabolismnames(HPA_Metabo) <- EnzymeTable$Description
HPA_Metabo$`Beta oxidation of fatty acids` <- unique(unlist(c(HPA_Metabo[10:21])))
HPA_Metabo$`Carnitine shuttle` <- unique(unlist(c(HPA_Metabo[31:33])))
HPA_Metabo$`Fatty acid activaton` <- unique(unlist(c(HPA_Metabo[46:47])))
HPA_Metabo$`Fatty acid biosynthesis` <- unique(unlist(c(HPA_Metabo[49:51])))
HPA_Metabo2 <- HPA_Metabo[c(1,2,3,4,5,135,136,137,22,37,40,41,42,48,56,60,62,63,66,70,92,95,103,104,105,106,107,108,109,111,113)]
# Plot results
results_df <- perform_module_disease_analysis_2(toptable = Toptable_Modules, diseaseGenes = HPA_Metabo2)
melted_results <- melt(results_df, id.vars = c("Modules", "Disease", "PercentOverlap", "FisherPValue","OddsRatio" ))
# First, create a new column that indicates where to place stars
melted_results$Star <- ifelse(melted_results$FisherPValue < 0.05 & melted_results$OddsRatio > 1, "*", "")
melted_results_2 <- melted_results
module_order <- c("green","darkgreen","midnightblue","salmon","lightyellow", "lightgreen","blue", "magenta","darkred", "brown", "yellow", "royalblue", "grey")
# Factor the Module column in Fulltrait_df
melted_results_2$Modules <- factor(melted_results_2$Modules, levels = module_order)
Enzyme_termlistsubset <- melted_results_2[(melted_results_2$FisherPValue <0.05) & (melted_results_2$OddsRatio > 1) & (melted_results_2$Modules %in% c("green","darkgreen","midnightblue","salmon","lightyellow")), ]$Disease %>% unique()
Enzyme_termlistsubset[1] "Oxidative phosphorylation"
[2] "Amino sugar and nucleotide sugar metabolism"
[3] "Beta oxidation of fatty acids"
[4] "Fatty acid activaton"
[5] "Cysteine and methionine metabolism"
[6] "Drug metabolism"
[7] "Fatty acid oxidation"
[8] "Glutathione metabolism"
[9] "Purine metabolism" melted_results_3 <- melted_results_2[(melted_results_2$Disease %in% Enzyme_termlistsubset) & ((melted_results_2$Modules %in% c("green","darkgreen","midnightblue","salmon","lightyellow"))), ]
# Vertical
ggplot(melted_results_3, aes(x = Modules, y = Disease, fill = OddsRatio)) +
geom_tile(color = "black") +
scale_fill_gradientn(colors = c("white", "darkviolet", "red"),
values = scales::rescale(c(0, 3, 60)),
na.value = "grey50", name = "Odds ratio") +
geom_text(aes(label = Star), color = "black", size = 4, na.rm = TRUE) +
labs(x = "", y = "") +
theme_minimal() +
theme(
axis.text.x = element_text(angle = 90, vjust = 0.5, hjust = 1),
axis.text.y = element_text(hjust = 0.5),
axis.title = element_text(size = 12),
legend.key.size = unit(0.6, 'cm'),
legend.title = element_text(size = 10),
legend.text = element_text(size = 8)
)
| Version | Author | Date |
|---|---|---|
| 50450f1 | Omar-Johnson | 2024-07-23 |
EZ_subset <- strsplit(melted_results_3$value, ";") %>% unlist() %>% unique()

EZ_Dataforplot_ordered <- TF_Dataforplot_ordered[TF_Dataforplot_ordered$Protein %in% EZ_subset, ]


EZ_Dataforplot_ordered <- EZ_Dataforplot_ordered[order(-abs(EZ_Dataforplot_ordered$Pro_LogFC)), ]

# Subset the top 20 rows
EZ_Dataforplot_ordered_top_20 <- head(EZ_Dataforplot_ordered, 20)

# Reorder hgnc_symbol based on Pro_LogFC
EZ_Dataforplot_ordered_top_20$hgnc_symbol <- factor(EZ_Dataforplot_ordered_top_20$hgnc_symbol,
                                            levels = EZ_Dataforplot_ordered_top_20$hgnc_symbol[order(EZ_Dataforplot_ordered_top_20$Pro_LogFC)])

# Plot for all enzymes
ggplot(EZ_Dataforplot_ordered_top_20, aes(x = hgnc_symbol, y = Pro_LogFC, fill = Modules)) +
  geom_bar(stat = "identity") +
  labs(
    y = "logFC",
    fill = "Modules"
  ) +
  theme_classic() +
  theme(axis.text.x = element_text(angle = 45, hjust = 1)) +
  scale_fill_identity() +
  ylim(c(-3.5, 3.5))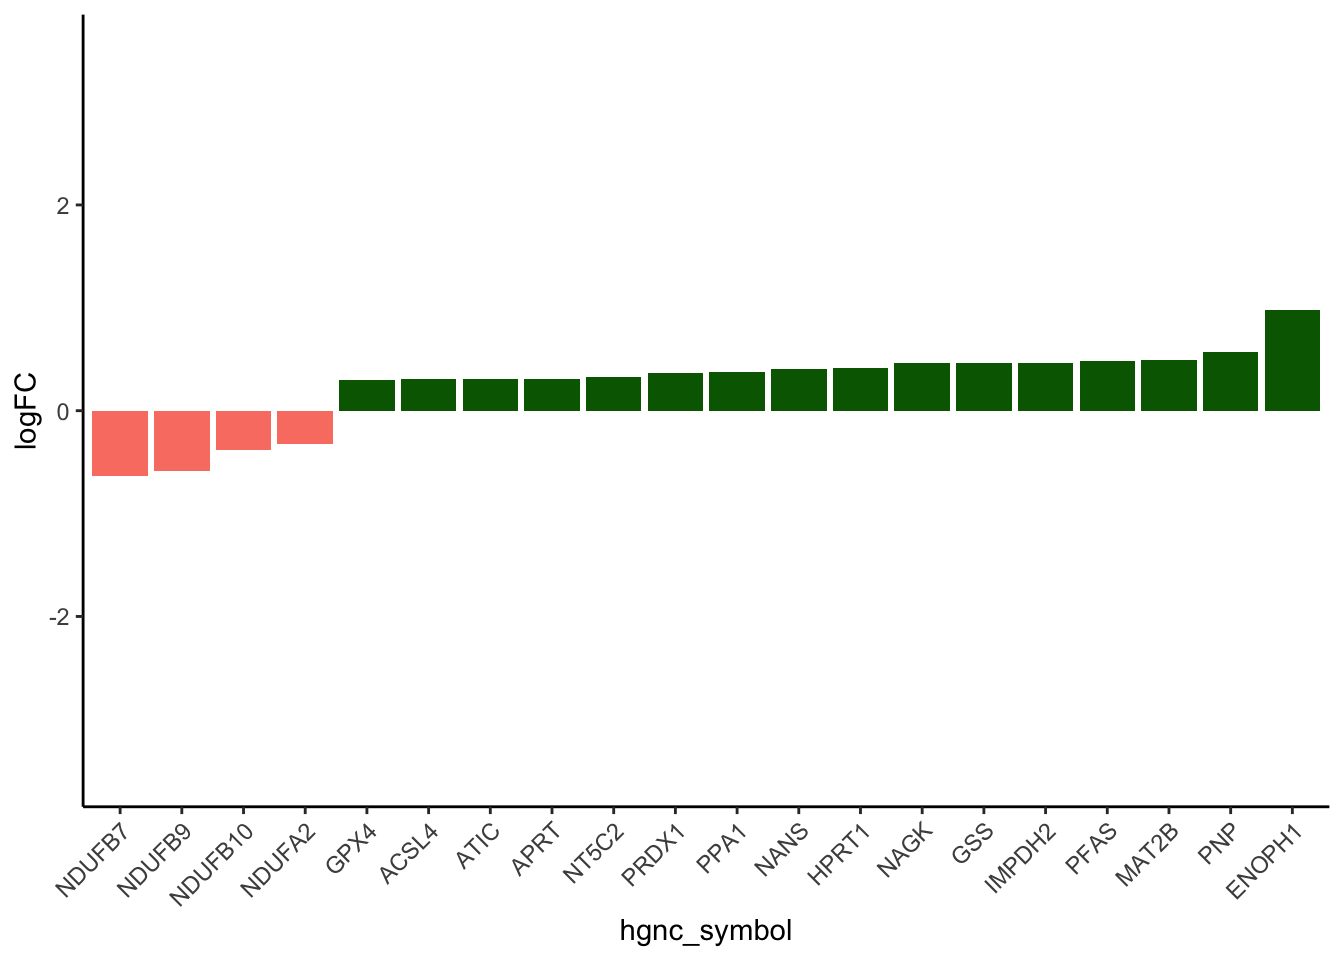
| Version | Author | Date |
|---|---|---|
| 50450f1 | Omar-Johnson | 2024-07-23 |
Fig S10 Protein families
# Protein families

Fam_db %>% colnames()
[1] "From" "Entry"
[3] "Reviewed" "Entry.Name"
[5] "Protein.names" "Gene.Names"
[7] "Length" "Protein.families"
[9] "InterPro" "NCBIfam"
[11] "Chain" "Cross.link"
[13] "Disulfide.bond" "Glycosylation"
[15] "Peptide" "Modified.residue"
[17] "Lipidation" "Initiator.methionine"
[19] "Post.translational.modification" "Propeptide"
[21] "Signal.peptide" "Transit.peptide"
[23] "PubMed.ID" "DOI.ID"
[25] "Date.of.last.modification" "Entry.version" Fam_db2 <- Fam_db[, colnames(Fam_db) %in% c("From","Protein.names", "Gene.Names", "Protein.families" , "InterPro" )]
Fam_db2 %>% dim()[1] 4178 5Fam_db2 %>% colnames()[1] "From" "Protein.names" "Gene.Names" "Protein.families"
[5] "InterPro" Fam_db2_modules <- merge(Toptable_Modules, Fam_db2, by.x = "Protein", by.y ="From" )
Fam_db2_modules %>% colnames() [1] "Protein" "X" "kTotal"
[4] "kWithin" "kOut" "kDiff"
[7] "logFC" "AveExpr" "t"
[10] "P.Value" "adj.P.Val" "B"
[13] "threshold_P" "Modules" "DE_or_Not"
[16] "Norm_kIN" "Norm_kOut" "logFC.y"
[19] "AveExpr.y" "t.y" "P.Value.y"
[22] "adj.P.Val.y" "B.y" "threshold_P.y"
[25] "Modules.y" "DE_or_Not.y" "Is_DA"
[28] "Is_DOXcorrelated" "Is_Hub" "Is_Cis_pQTL"
[31] "Is_Trans_pQTL" "Is_pQTL" "pLI_assigned"
[34] "pLI_Mut.Intolerant" "pLI_Mut.Tolerant" "Is_Druggable"
[37] "Is_CVD_protein" "Is_CVD_PPI_protein" "Protein.names"
[40] "Gene.Names" "Protein.families" "InterPro" Fam_db2_modules %>% head() Protein X kTotal kWithin kOut kDiff logFC AveExpr
1 A0A0B4J2A2 1 43.798603 28.792924 15.005679 13.787244 0.02740191 18.36074
2 A0A0B4J2D5 2 41.485601 16.046206 25.439395 -9.393189 0.13528476 23.88276
3 A0A494C071 3 11.380860 4.189016 7.191844 -3.002828 -0.10207488 17.99859
4 A0AVT1 4 57.970567 40.851321 17.119246 23.732076 0.28958132 13.44419
5 A0FGR8 5 47.366817 39.629343 7.737474 31.891869 0.09891217 20.14964
6 A0JLT2 6 8.837194 7.106150 1.731044 5.375106 0.14029123 17.75159
t P.Value adj.P.Val B threshold_P Modules DE_or_Not
1 0.1652536 0.8740733 0.8740733 -6.909831 FALSE darkred FALSE
2 1.3173430 0.2349365 0.2349365 -6.046336 FALSE royalblue FALSE
3 -1.1698611 0.2851794 0.2851794 -6.214905 FALSE green FALSE
4 1.1568528 0.2903888 0.2903888 -6.228915 FALSE darkred FALSE
5 1.1875531 0.2786322 0.2786322 -6.195353 FALSE royalblue FALSE
6 0.6135087 0.5616554 0.5616554 -6.715102 FALSE royalblue FALSE
Norm_kIN Norm_kOut logFC.y AveExpr.y t.y P.Value.y
1 0.036081358 0.0044395501 0.02740191 18.36074 0.1652536 0.8740733
2 0.022442246 0.0073460569 0.13528476 23.88276 1.3173430 0.2349365
3 0.007234915 0.0019982895 -0.10207488 17.99859 -1.1698611 0.2851794
4 0.051192132 0.0050648656 0.28958132 13.44419 1.1568528 0.2903888
5 0.055425655 0.0022343269 0.09891217 20.14964 1.1875531 0.2786322
6 0.009938672 0.0004998683 0.14029123 17.75159 0.6135087 0.5616554
adj.P.Val.y B.y threshold_P.y Modules.y DE_or_Not.y Is_DA
1 0.8740733 -6.909831 FALSE darkred FALSE 0
2 0.2349365 -6.046336 FALSE royalblue FALSE 0
3 0.2851794 -6.214905 FALSE green FALSE 0
4 0.2903888 -6.228915 FALSE darkred FALSE 0
5 0.2786322 -6.195353 FALSE royalblue FALSE 0
6 0.5616554 -6.715102 FALSE royalblue FALSE 0
Is_DOXcorrelated Is_Hub Is_Cis_pQTL Is_Trans_pQTL Is_pQTL pLI_assigned
1 0 0 0 0 0 0
2 0 0 0 0 0 0
3 1 0 0 0 0 0
4 0 0 0 0 0 1
5 0 0 1 1 1 1
6 0 0 0 0 0 1
pLI_Mut.Intolerant pLI_Mut.Tolerant Is_Druggable Is_CVD_protein
1 0 0 0 0
2 0 0 0 0
3 0 0 0 0
4 0 1 0 0
5 0 1 0 0
6 0 0 0 0
Is_CVD_PPI_protein
1 0
2 0
3 0
4 0
5 0
6 0
Protein.names
1 Peptidyl-prolyl cis-trans isomerase A-like 4C (PPIase A-like 4C) (EC 5.2.1.8)
2 Putative glutamine amidotransferase-like class 1 domain-containing protein 3B, mitochondrial (Keio novel protein-I) (KNP-I) (Protein GT335) (Protein HES1)
3 PWWP domain-containing DNA repair factor 4
4 Ubiquitin-like modifier-activating enzyme 6 (Ubiquitin-activating enzyme 6) (EC 6.2.1.45) (Monocyte protein 4) (MOP-4) (Ubiquitin-activating enzyme E1-like protein 2) (E1-L2)
5 Extended synaptotagmin-2 (E-Syt2) (Chr2Syt)
6 Mediator of RNA polymerase II transcription subunit 19 (Lung cancer metastasis-related protein 1) (Mediator complex subunit 19)
Gene.Names Protein.families
1 PPIAL4C Cyclophilin-type PPIase family, PPIase A subfamily
2 GATD3B HES1 KNPI GATD3 family
3 PWWP4 PWWP3A family
4 UBA6 MOP4 UBE1L2 Ubiquitin-activating E1 family
5 ESYT2 FAM62B KIAA1228 Extended synaptotagmin family
6 MED19 LCMR1 Mediator complex subunit 19 family
InterPro
1 IPR029000;IPR024936;IPR020892;IPR002130;
2 IPR029062;
3 IPR035504;IPR040263;IPR048795;IPR048765;
4 IPR032420;IPR032418;IPR042302;IPR045886;IPR000594;IPR018965;IPR042449;IPR038252;IPR019572;IPR042063;IPR035985;IPR018075;IPR000011;
5 IPR000008;IPR035892;IPR037752;IPR037733;IPR037749;IPR031468;IPR039010;
6 IPR019403;#### With regular readable ID ####
library(data.table)
Attaching package: 'data.table'The following objects are masked from 'package:reshape2':
dcast, meltThe following objects are masked from 'package:lubridate':
hour, isoweek, mday, minute, month, quarter, second, wday, week,
yday, yearThe following objects are masked from 'package:dplyr':
between, first, lastThe following object is masked from 'package:purrr':
transposeThe following object is masked from 'package:ShortRead':
tablesThe following objects are masked from 'package:GenomicAlignments':
first, last, secondThe following object is masked from 'package:SummarizedExperiment':
shiftThe following object is masked from 'package:GenomicRanges':
shiftThe following object is masked from 'package:IRanges':
shiftThe following objects are masked from 'package:S4Vectors':
first, second# Convert to data.table for faster operations
setDT(Fam_db2_modules)
# Unique modules and protein families
unique_modules <- unique(Fam_db2_modules$Modules)
unique_protein_families <- unique(Fam_db2_modules$Protein.families)
# Define a function to perform Fisher's Exact Test
perform_fishers_test <- function(module, family, df) {
# Count the number of occurrences in and out of the module
in_module_and_family <- sum(df$Modules == module & df$Protein.families == family)
in_module_not_family <- sum(df$Modules == module & df$Protein.families != family)
not_in_module_and_family <- sum(df$Modules != module & df$Protein.families == family)
not_in_module_not_family <- sum(df$Modules != module & df$Protein.families != family)
# Create contingency table
contingency_table <- matrix(c(in_module_and_family, in_module_not_family,
not_in_module_and_family, not_in_module_not_family),
nrow = 2)
# Perform Fisher's Exact Test
fisher_result <- fisher.test(contingency_table)
return(fisher_result$p.value)
}
# Initialize a data frame to store results
enrichment_results <- data.frame(Module = rep(unique_modules, each = length(unique_protein_families)),
Family = rep(unique_protein_families, times = length(unique_modules)),
Fisher_p_value = NA)
# Loop through each module and protein family and perform Fisher's test
for(i in 1:nrow(enrichment_results)) {
module <- enrichment_results$Module[i]
family <- enrichment_results$Family[i]
p_value <- perform_fishers_test(module, family, Fam_db2_modules)
enrichment_results$Fisher_p_value[i] <- p_value
}
# Ensure all p-values are within [0, 1]
enrichment_results_2 <- enrichment_results[!is.na(enrichment_results$Fisher_p_value) & enrichment_results$Fisher_p_value >= 0 & enrichment_results$Fisher_p_value <= 1, ]
# Output the results
Famenrich_pval_05 <- enrichment_results_2[enrichment_results_2$Fisher_p_value < 0.05, ]
Famenrich_pval_01 <- enrichment_results_2[enrichment_results_2$Fisher_p_value < 0.01, ]
Famenrich_pval_01$Module [1] "darkred" "darkred" "darkred" "darkred" "darkred"
[6] "darkred" "darkred" "darkred" "darkred" "royalblue"
[11] "royalblue" "royalblue" "royalblue" "royalblue" "royalblue"
[16] "royalblue" "royalblue" "royalblue" "royalblue" "green"
[21] "green" "green" "green" "lightgreen" "lightgreen"
[26] "lightgreen" "lightgreen" "lightgreen" "lightgreen" "lightyellow"
[31] "magenta" "magenta" "magenta" "magenta" "magenta"
[36] "grey" "salmon" "salmon" "salmon" "salmon"
[41] "salmon" "salmon" "salmon" "salmon" "salmon"
[46] "darkgreen" "darkgreen" "darkgreen" "darkgreen" "darkgreen"
[51] "darkgreen" "midnightblue" "midnightblue" "midnightblue" "midnightblue"
[56] "midnightblue" "midnightblue" "midnightblue" "brown" "brown"
[61] "brown" Famenrich_pval_05[Famenrich_pval_05$Module %in% c("green"), ] Module Family Fisher_p_value
4238 green 6.539029e-19
4362 green Splicing factor SR family 4.178986e-06
4391 green Histone deacetylase family, HD type 1 subfamily 2.649652e-03
4438 green Mitochondrial carrier (TC 2.A.29) family 2.564945e-02
4455 green SNF2/RAD54 helicase family, ISWI subfamily 1.917668e-02
4525 green Nucleoplasmin family 1.917668e-02
4590 green CELF/BRUNOL family 1.917668e-02
4811 green DEAD box helicase family, DDX5/DBP2 subfamily 1.917668e-02
4922 green RNA polymerase beta chain family 1.917668e-02
4992 green Eukaryotic ribosomal protein eS27 family 1.917668e-02
5192 green SnRNP Sm proteins family, SmF/LSm6 subfamily 1.917668e-02
5287 green RNase PH family 5.035820e-05
5580 green AlkB family 1.917668e-02
5671 green IRF2BP family 1.917668e-02
5761 green SMARCC family 1.917668e-02
5792 green Ataxin-2 family 1.917668e-02
5938 green DEAD box helicase family, DDX21/DDX50 subfamily 1.917668e-02# Visualize terms
ggplot(data = Famenrich_pval_05[Famenrich_pval_05$Module %in% c("green"), ], aes(x = -log(Fisher_p_value), y = reorder(Family, -log(Fisher_p_value)), fill = Module)) +
geom_bar(stat = "identity") +
labs(
x = "-log(p-adj)",
y = "Family",
fill = "Module",
title = "GO enrichment analysis"
) +
theme_classic() +
theme(axis.text.x = element_text(angle = 45, hjust = 1)) +
xlim(c(0, 20)) +
scale_fill_identity(guide = "legend") +
facet_wrap(~ Module, ncol = 1, scales = "free_y")Warning: Removed 1 rows containing missing values (`position_stack()`).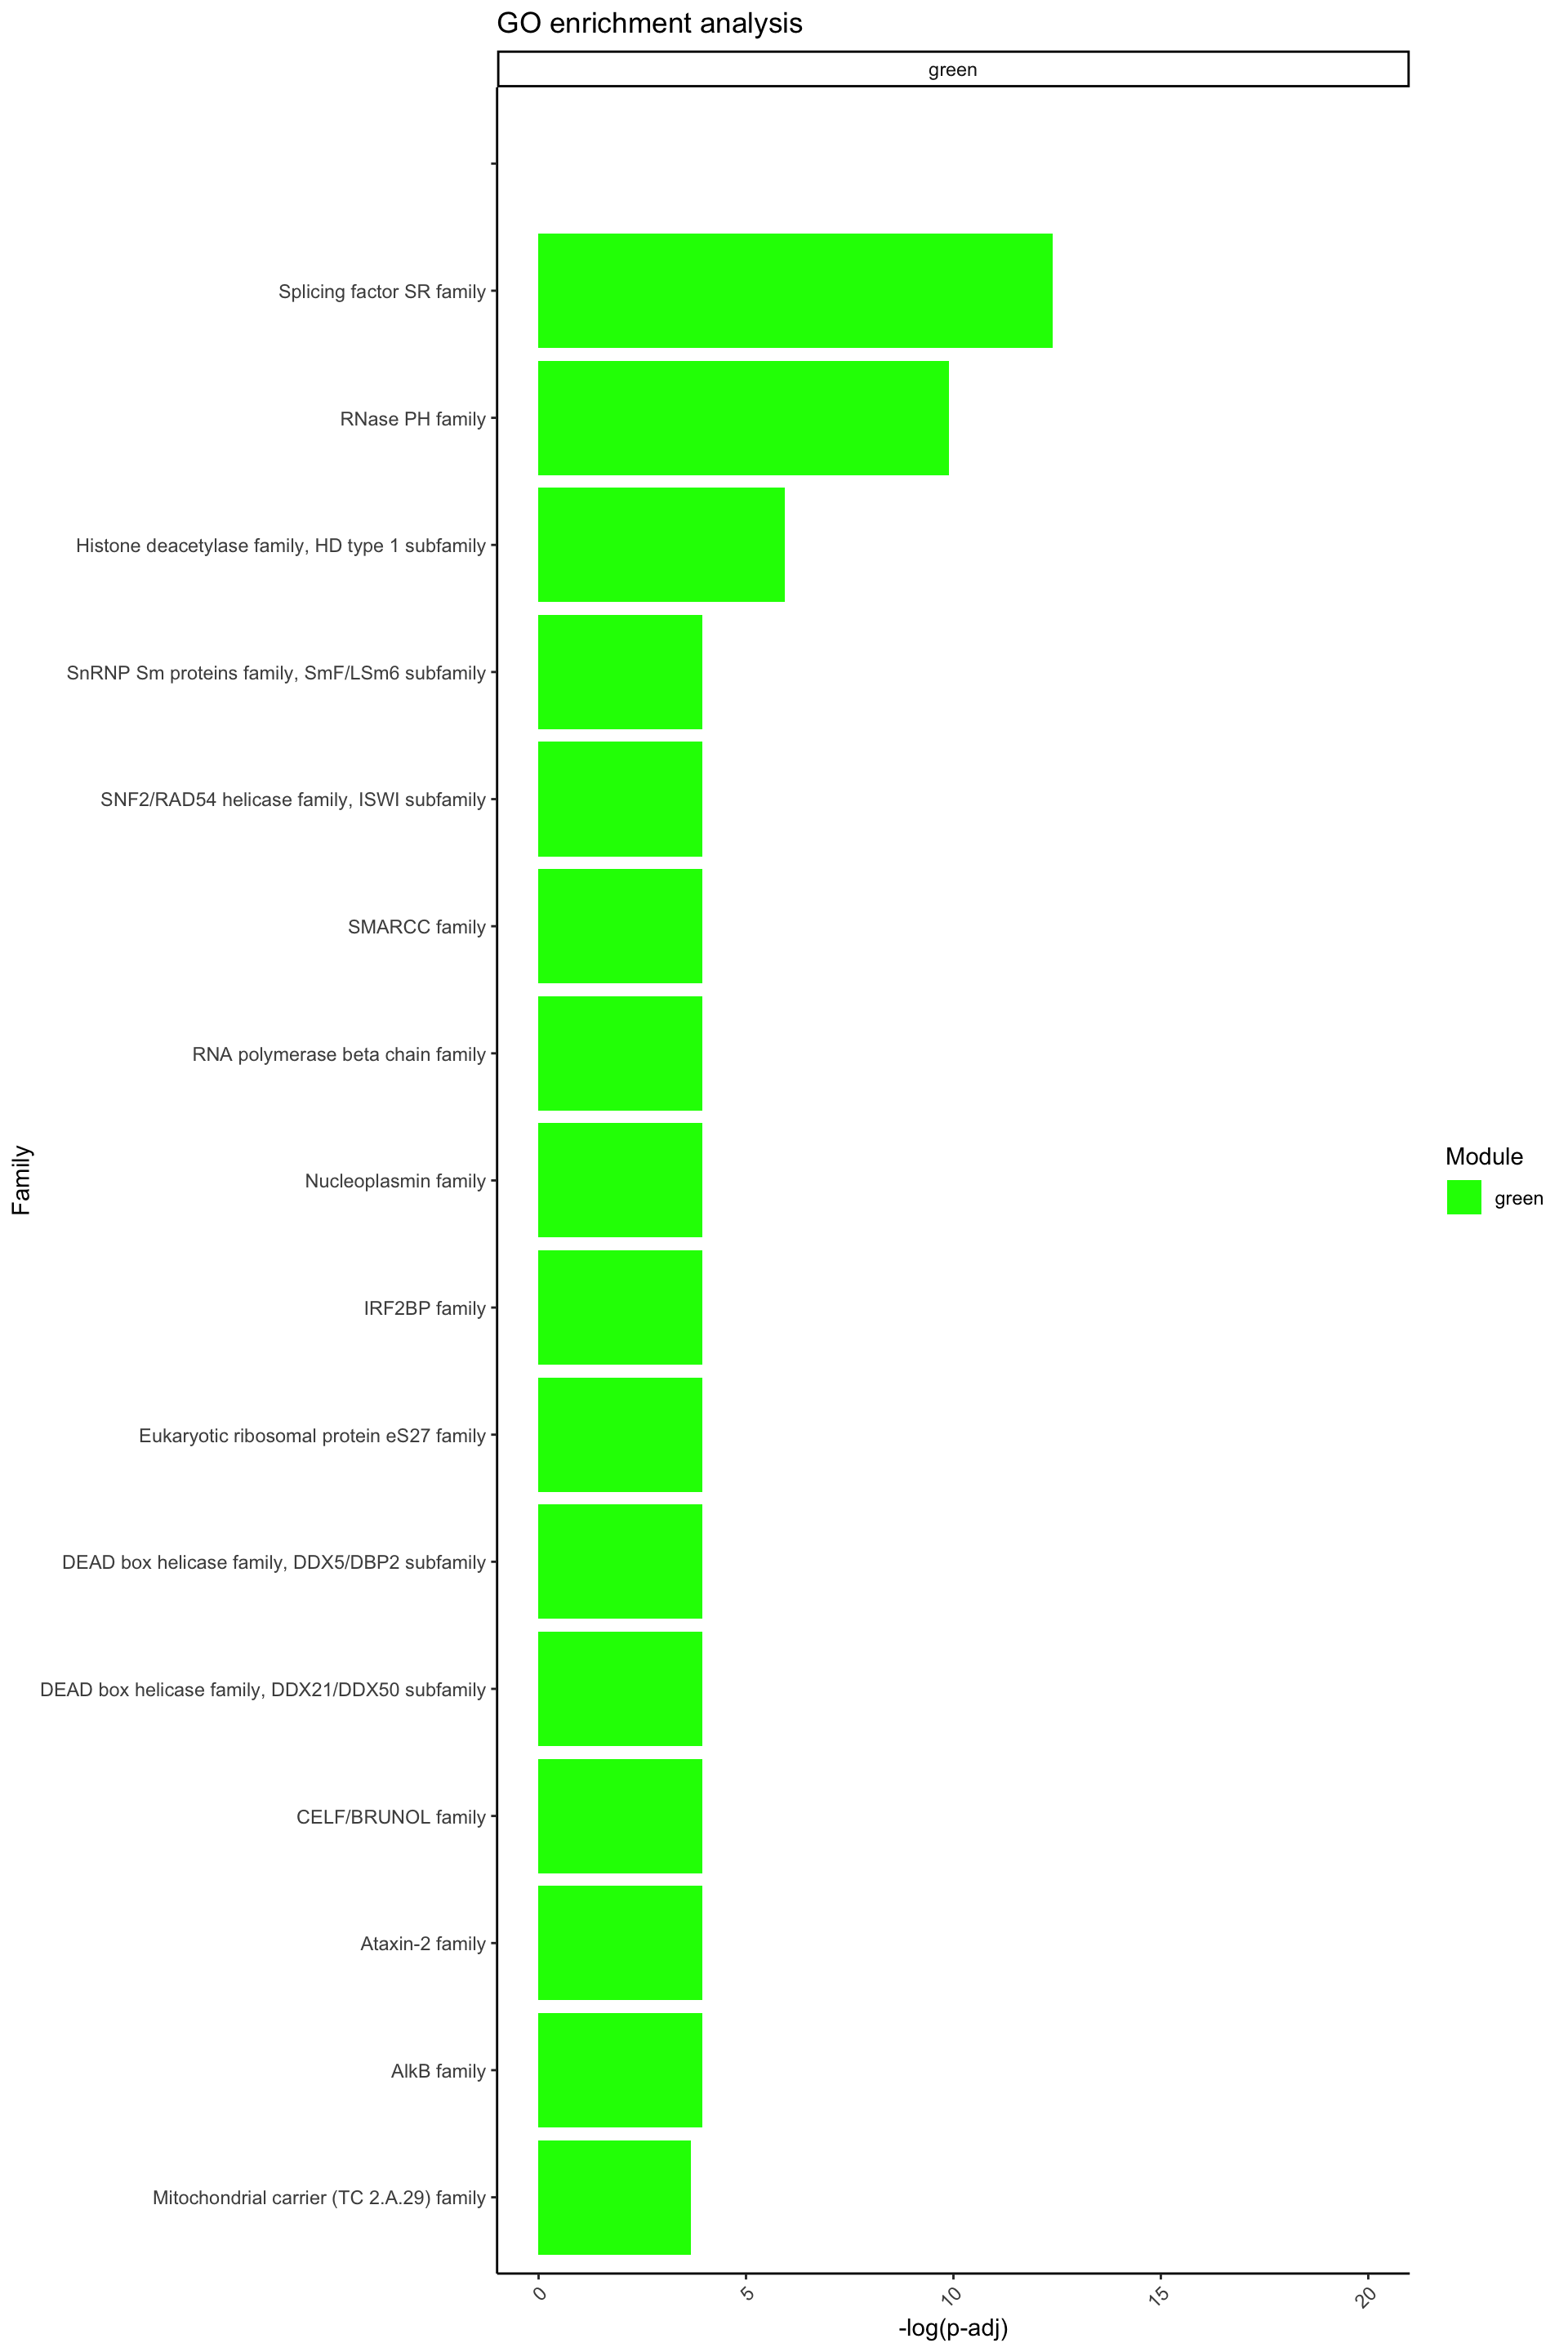
ggplot(data = Famenrich_pval_05[Famenrich_pval_05$Module %in% c("darkgreen"), ], aes(x = -log(Fisher_p_value), y = reorder(Family, -log(Fisher_p_value)), fill = Module)) +
  geom_bar(stat = "identity") +
  labs(
    x = "-log(p-adj)",
    y = "Family",
    fill = "Module",
    title = "GO enrichment analysis"
  ) +
  theme_classic() +
  theme(axis.text.x = element_text(angle = 45, hjust = 1)) +
  xlim(c(0, 20)) +
  scale_fill_identity(guide = "legend") +
  facet_wrap(~ Module, ncol = 1, scales = "free_y")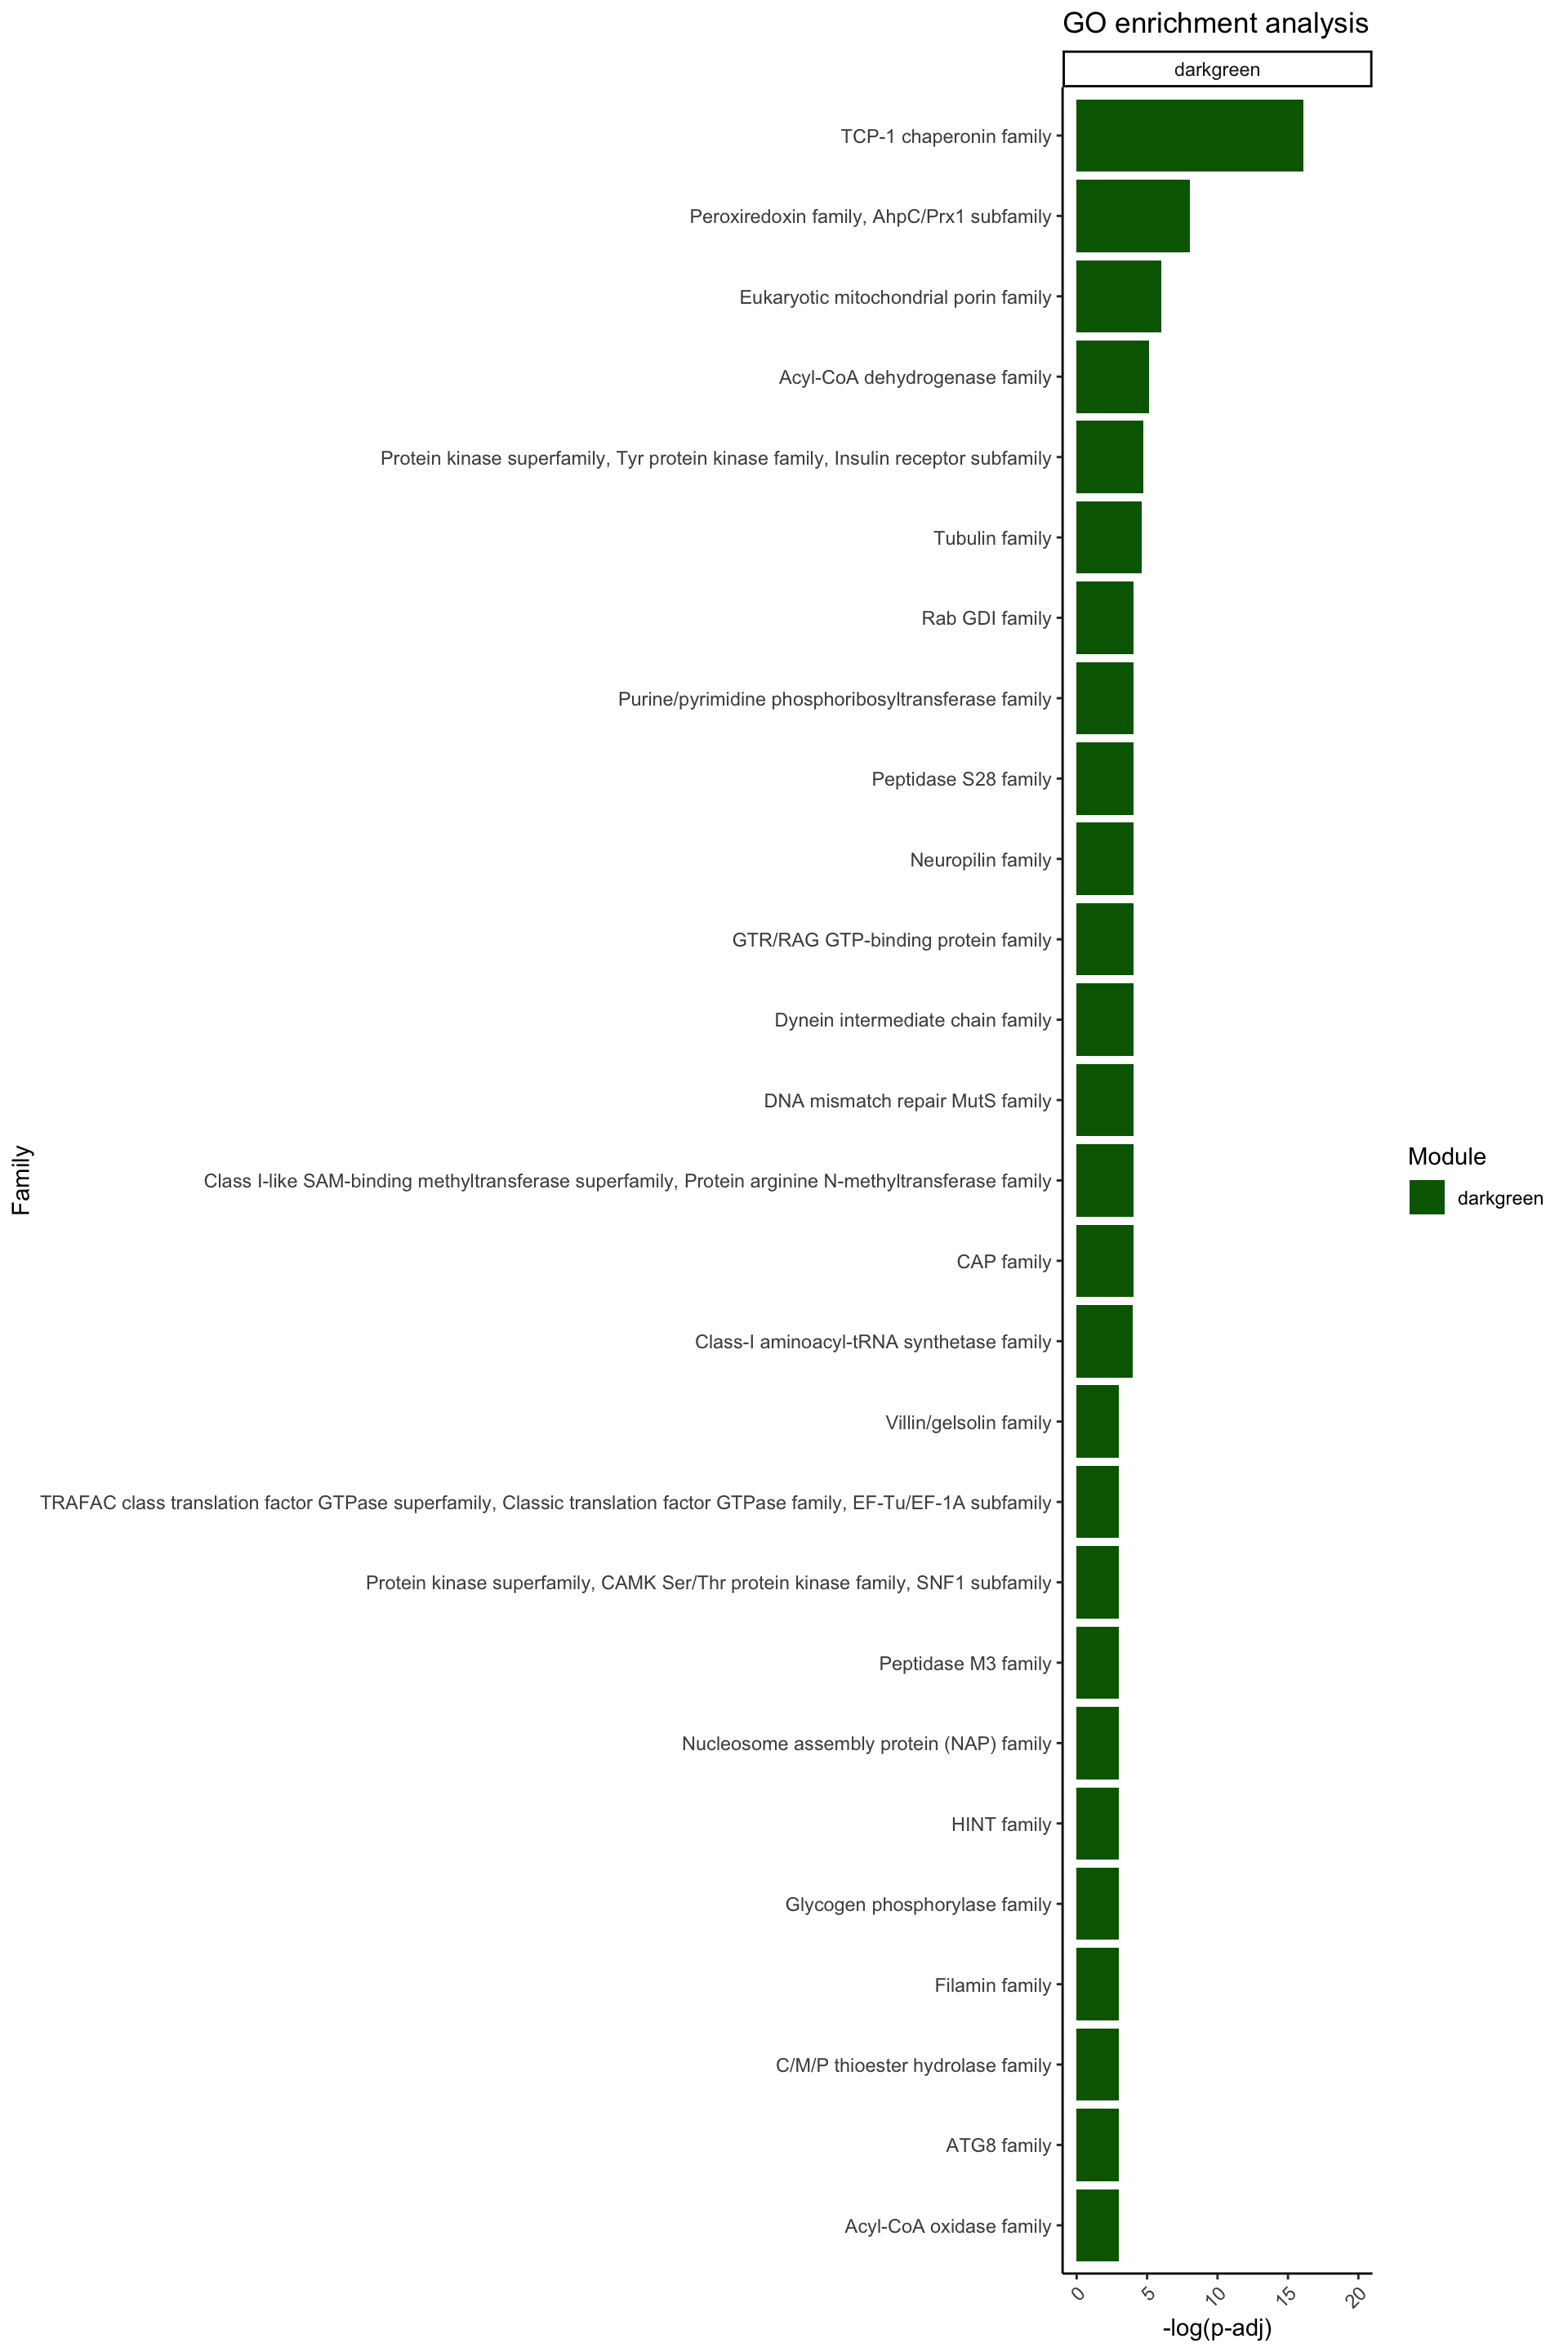
ggplot(data = Famenrich_pval_05[Famenrich_pval_05$Module %in% c("midnightblue"), ], aes(x = -log(Fisher_p_value), y = reorder(Family, -log(Fisher_p_value)), fill = Module)) +
  geom_bar(stat = "identity") +
  labs(
    x = "-log(p-adj)",
    y = "Family",
    fill = "Module",
    title = "GO enrichment analysis"
  ) +
  theme_classic() +
  theme(axis.text.x = element_text(angle = 45, hjust = 1)) +
  xlim(c(0, 20)) +
  scale_fill_identity(guide = "legend") +
  facet_wrap(~ Module, ncol = 1, scales = "free_y")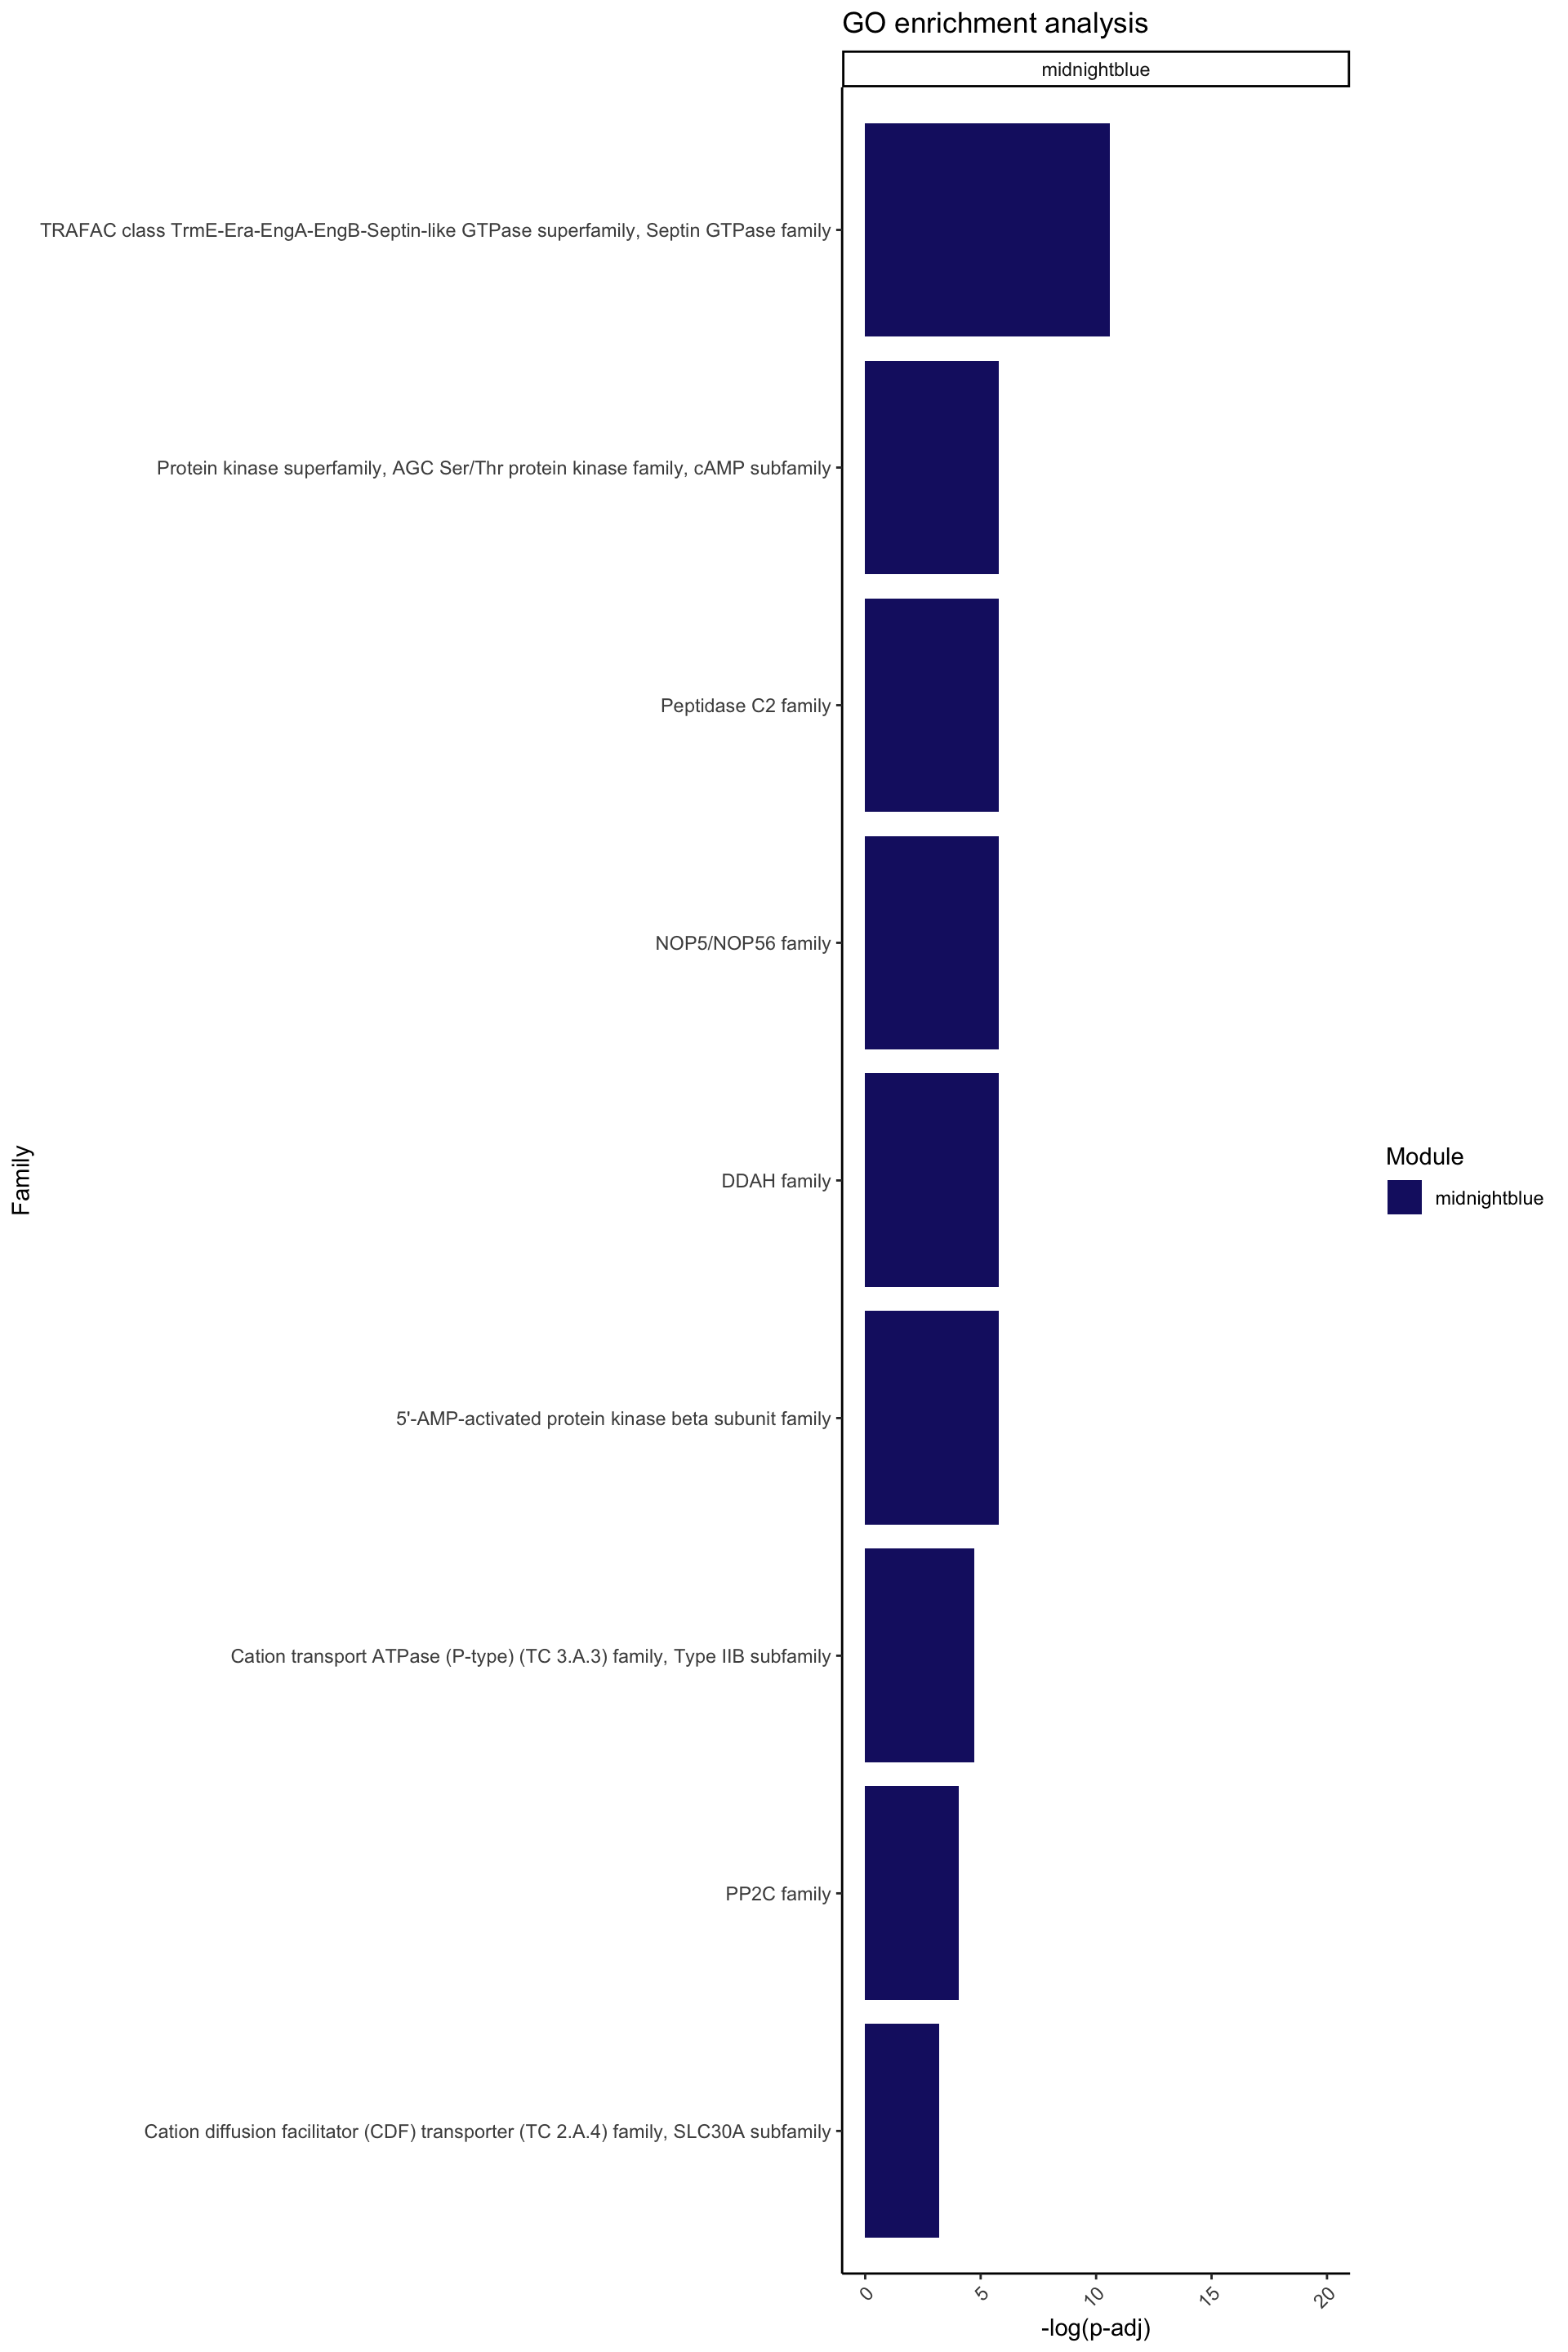
ggplot(data = Famenrich_pval_05[Famenrich_pval_05$Module %in% c("salmon"), ], aes(x = -log(Fisher_p_value), y = reorder(Family, -log(Fisher_p_value)), fill = Module)) +
  geom_bar(stat = "identity") +
  labs(
    x = "-log(p-adj)",
    y = "Family",
    fill = "Module",
    title = "GO enrichment analysis"
  ) +
  theme_classic() +
  theme(axis.text.x = element_text(angle = 45, hjust = 1)) +
  xlim(c(0, 20)) +
  scale_fill_identity(guide = "legend") +
  facet_wrap(~ Module, ncol = 1, scales = "free_y")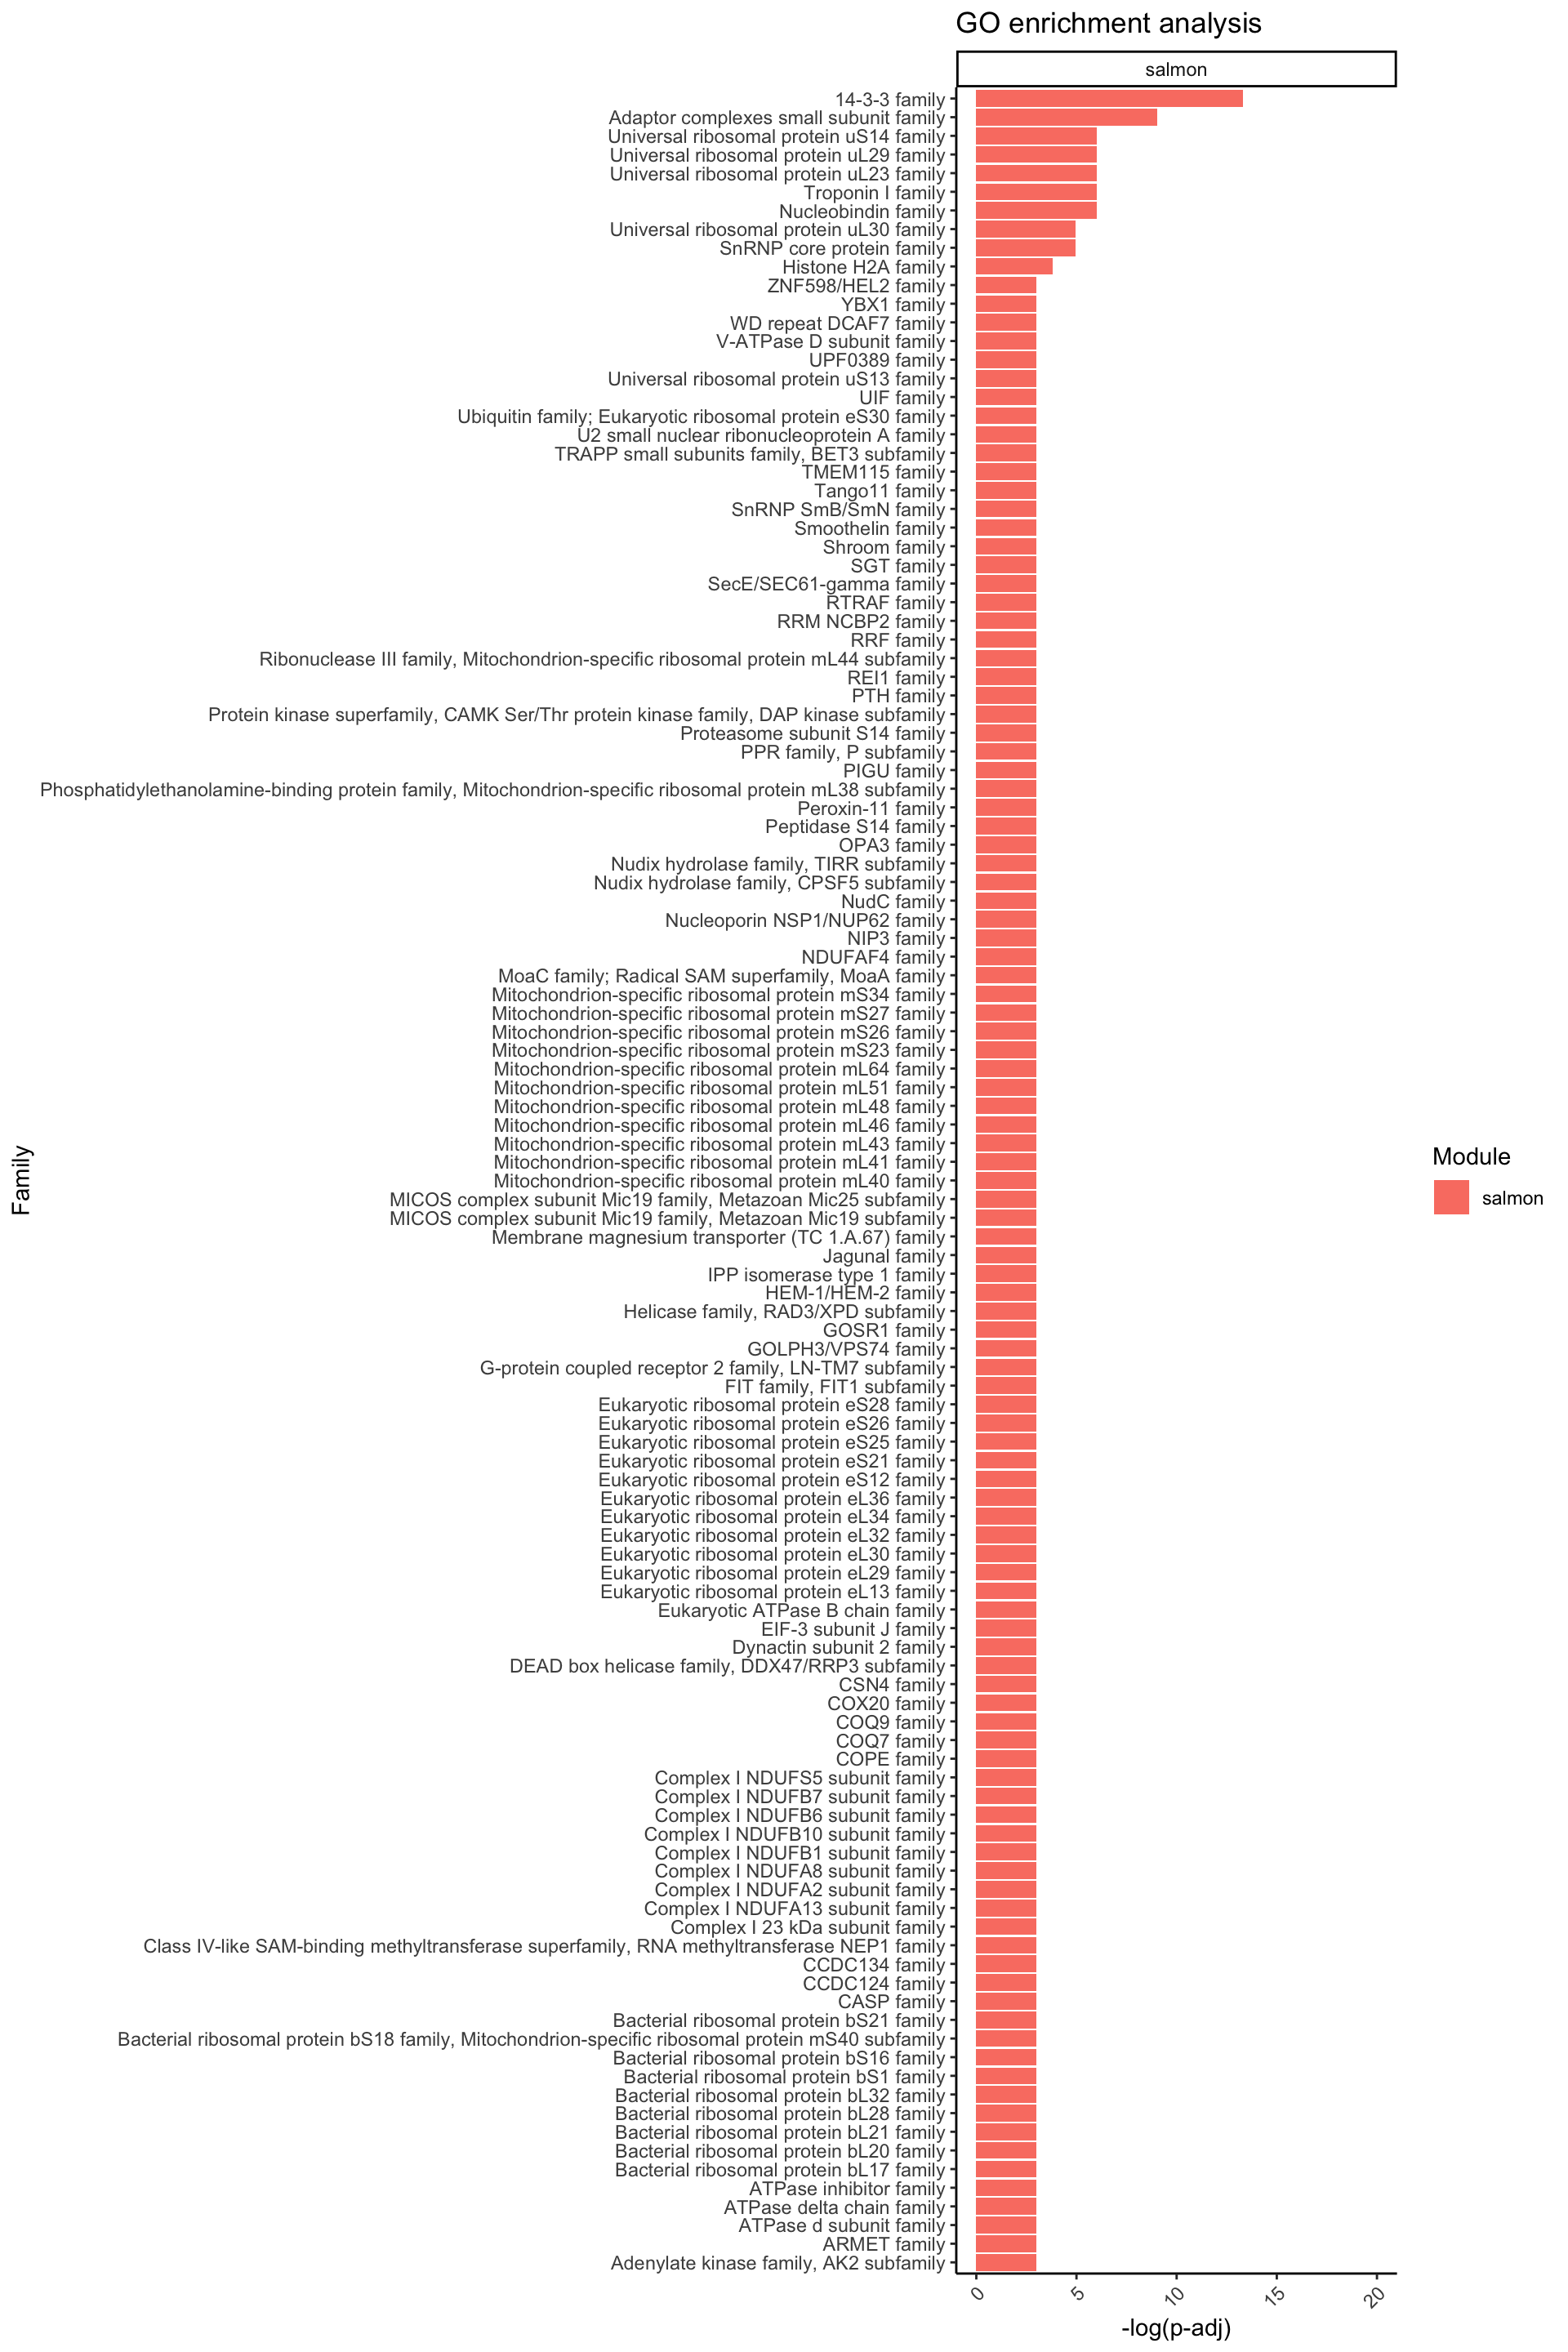
ggplot(data = Famenrich_pval_05[Famenrich_pval_05$Module %in% c("lightyellow"), ], aes(x = -log(Fisher_p_value), y = reorder(Family, -log(Fisher_p_value)), fill = Module)) +
  geom_bar(stat = "identity") +
  labs(
    x = "-log(p-adj)",
    y = "Family",
    fill = "Module",
    title = "GO enrichment analysis"
  ) +
  theme_classic() +
  theme(axis.text.x = element_text(angle = 45, hjust = 1)) +
  xlim(c(0, 20)) +
  scale_fill_identity(guide = "legend") +
  facet_wrap(~ Module, ncol = 1, scales = "free_y")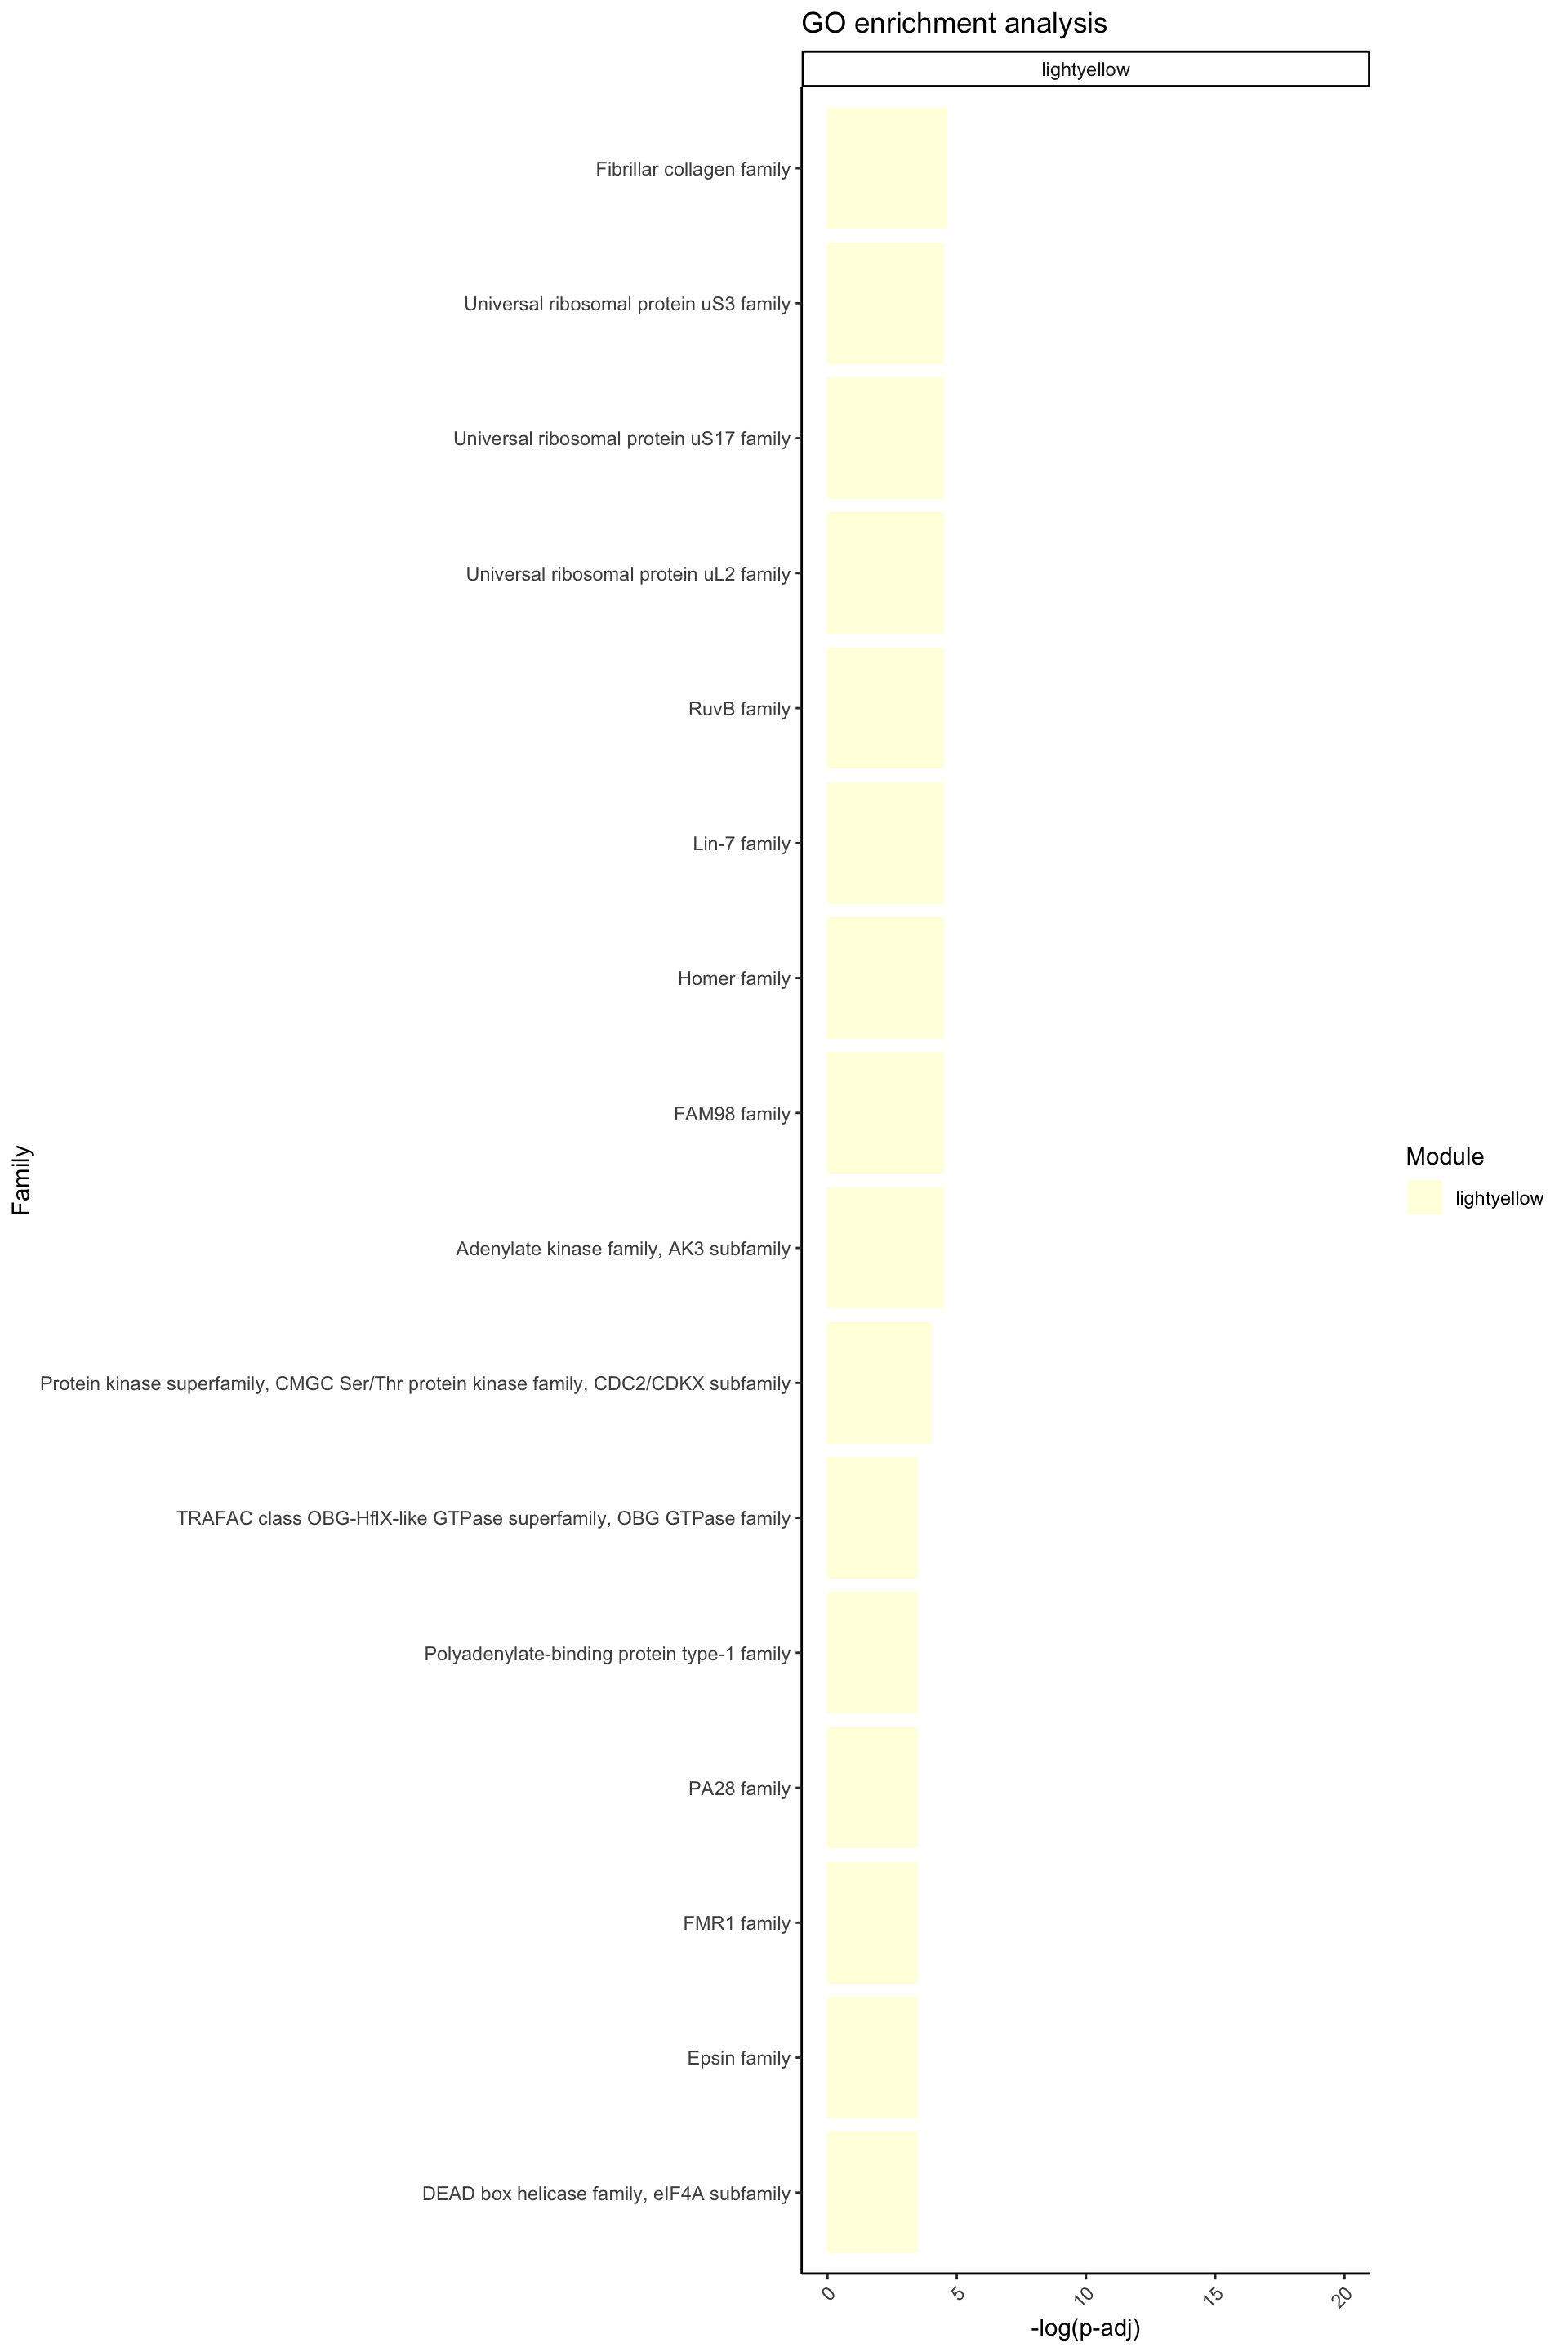
# Output the results
enrichment_results_sig <- Famenrich_pval_05
enrichment_results_sig_DOXcorr <- enrichment_results_sig[enrichment_results_sig$Module %in% c("green", "darkgreen", "midnightblue", "salmon","lightyellow"), ]


enrichment_results_sig_DOXcorr <- enrichment_results_sig_DOXcorr %>% as.tibble()
Warning: `as.tibble()` was deprecated in tibble 2.0.0.
ℹ Please use `as_tibble()` instead.
ℹ The signature and semantics have changed, see `?as_tibble`.
This warning is displayed once every 8 hours.
Call `lifecycle::last_lifecycle_warnings()` to see where this warning was
generated.enrichment_results_sig_DOXcorr %>% colnames()[1] "Module" "Family" "Fisher_p_value"enrichment_results_sig %>% nrow()[1] 451enrichment_results_sig_DOXcorr %>% nrow()[1] 186enrichment_results_sig_DOXcorr_top <- enrichment_results_sig_DOXcorr %>%
group_by(Module) %>%
top_n(-5, Fisher_p_value) %>%
ungroup()
enrichment_results_sig_DOXcorr_top %>% head()# A tibble: 6 × 3
Module Family Fisher_p_value
<chr> <chr> <dbl>
1 green "" 6.54e-19
2 green "Splicing factor SR family" 4.18e- 6
3 green "Histone deacetylase family, HD type 1 subfamily" 2.65e- 3
4 green "SNF2/RAD54 helicase family, ISWI subfamily" 1.92e- 2
5 green "Nucleoplasmin family" 1.92e- 2
6 green "CELF/BRUNOL family" 1.92e- 2# Arrange by adjusted p value
enrichment_results_sig_DOXcorr_top <- enrichment_results_sig_DOXcorr_top %>%
arrange(desc(enrichment_results_sig_DOXcorr_top))
enrichment_results_sig_DOXcorr_top$Family [1] "Universal ribosomal protein uS14 family"
[2] "Universal ribosomal protein uL29 family"
[3] "Universal ribosomal protein uL23 family"
[4] "Troponin I family"
[5] "Nucleobindin family"
[6] "Adaptor complexes small subunit family"
[7] "14-3-3 family"
[8] "TRAFAC class TrmE-Era-EngA-EngB-Septin-like GTPase superfamily, Septin GTPase family"
[9] "Protein kinase superfamily, AGC Ser/Thr protein kinase family, cAMP subfamily"
[10] "Peptidase C2 family"
[11] "NOP5/NOP56 family"
[12] "DDAH family"
[13] "5'-AMP-activated protein kinase beta subunit family"
[14] "Universal ribosomal protein uS3 family"
[15] "Universal ribosomal protein uS17 family"
[16] "Universal ribosomal protein uL2 family"
[17] "RuvB family"
[18] "Lin-7 family"
[19] "Homer family"
[20] "Fibrillar collagen family"
[21] "FAM98 family"
[22] "Adenylate kinase family, AK3 subfamily"
[23] "Splicing factor SR family"
[24] "SnRNP Sm proteins family, SmF/LSm6 subfamily"
[25] "SNF2/RAD54 helicase family, ISWI subfamily"
[26] "SMARCC family"
[27] "RNase PH family"
[28] "RNA polymerase beta chain family"
[29] "Nucleoplasmin family"
[30] "IRF2BP family"
[31] "Histone deacetylase family, HD type 1 subfamily"
[32] "Eukaryotic ribosomal protein eS27 family"
[33] "DEAD box helicase family, DDX5/DBP2 subfamily"
[34] "DEAD box helicase family, DDX21/DDX50 subfamily"
[35] "CELF/BRUNOL family"
[36] "Ataxin-2 family"
[37] "AlkB family"
[38] ""
[39] "TCP-1 chaperonin family"
[40] "Protein kinase superfamily, Tyr protein kinase family, Insulin receptor subfamily"
[41] "Peroxiredoxin family, AhpC/Prx1 subfamily"
[42] "Eukaryotic mitochondrial porin family"
[43] "Acyl-CoA dehydrogenase family" # Visualize the total enriched GO terms using a vertical bar plot
ggplot(data = enrichment_results_sig_DOXcorr_top, aes(x = -log(Fisher_p_value), y = reorder(Family, -log(Fisher_p_value)), fill = Module)) +
geom_bar(stat = "identity") +
labs(
x = "-log(p-adj)",
y = "Biological Processes",
fill = "Module",
title = "GO enrichment analysis"
) +
theme_minimal() +
theme(axis.text.x = element_text(angle = 45, hjust = 1)) +
xlim(c(0, 30)) +
scale_fill_identity(guide = "legend") +
facet_wrap(~ Module, ncol = 1, scales = "free_y")Warning: Removed 1 rows containing missing values (`position_stack()`).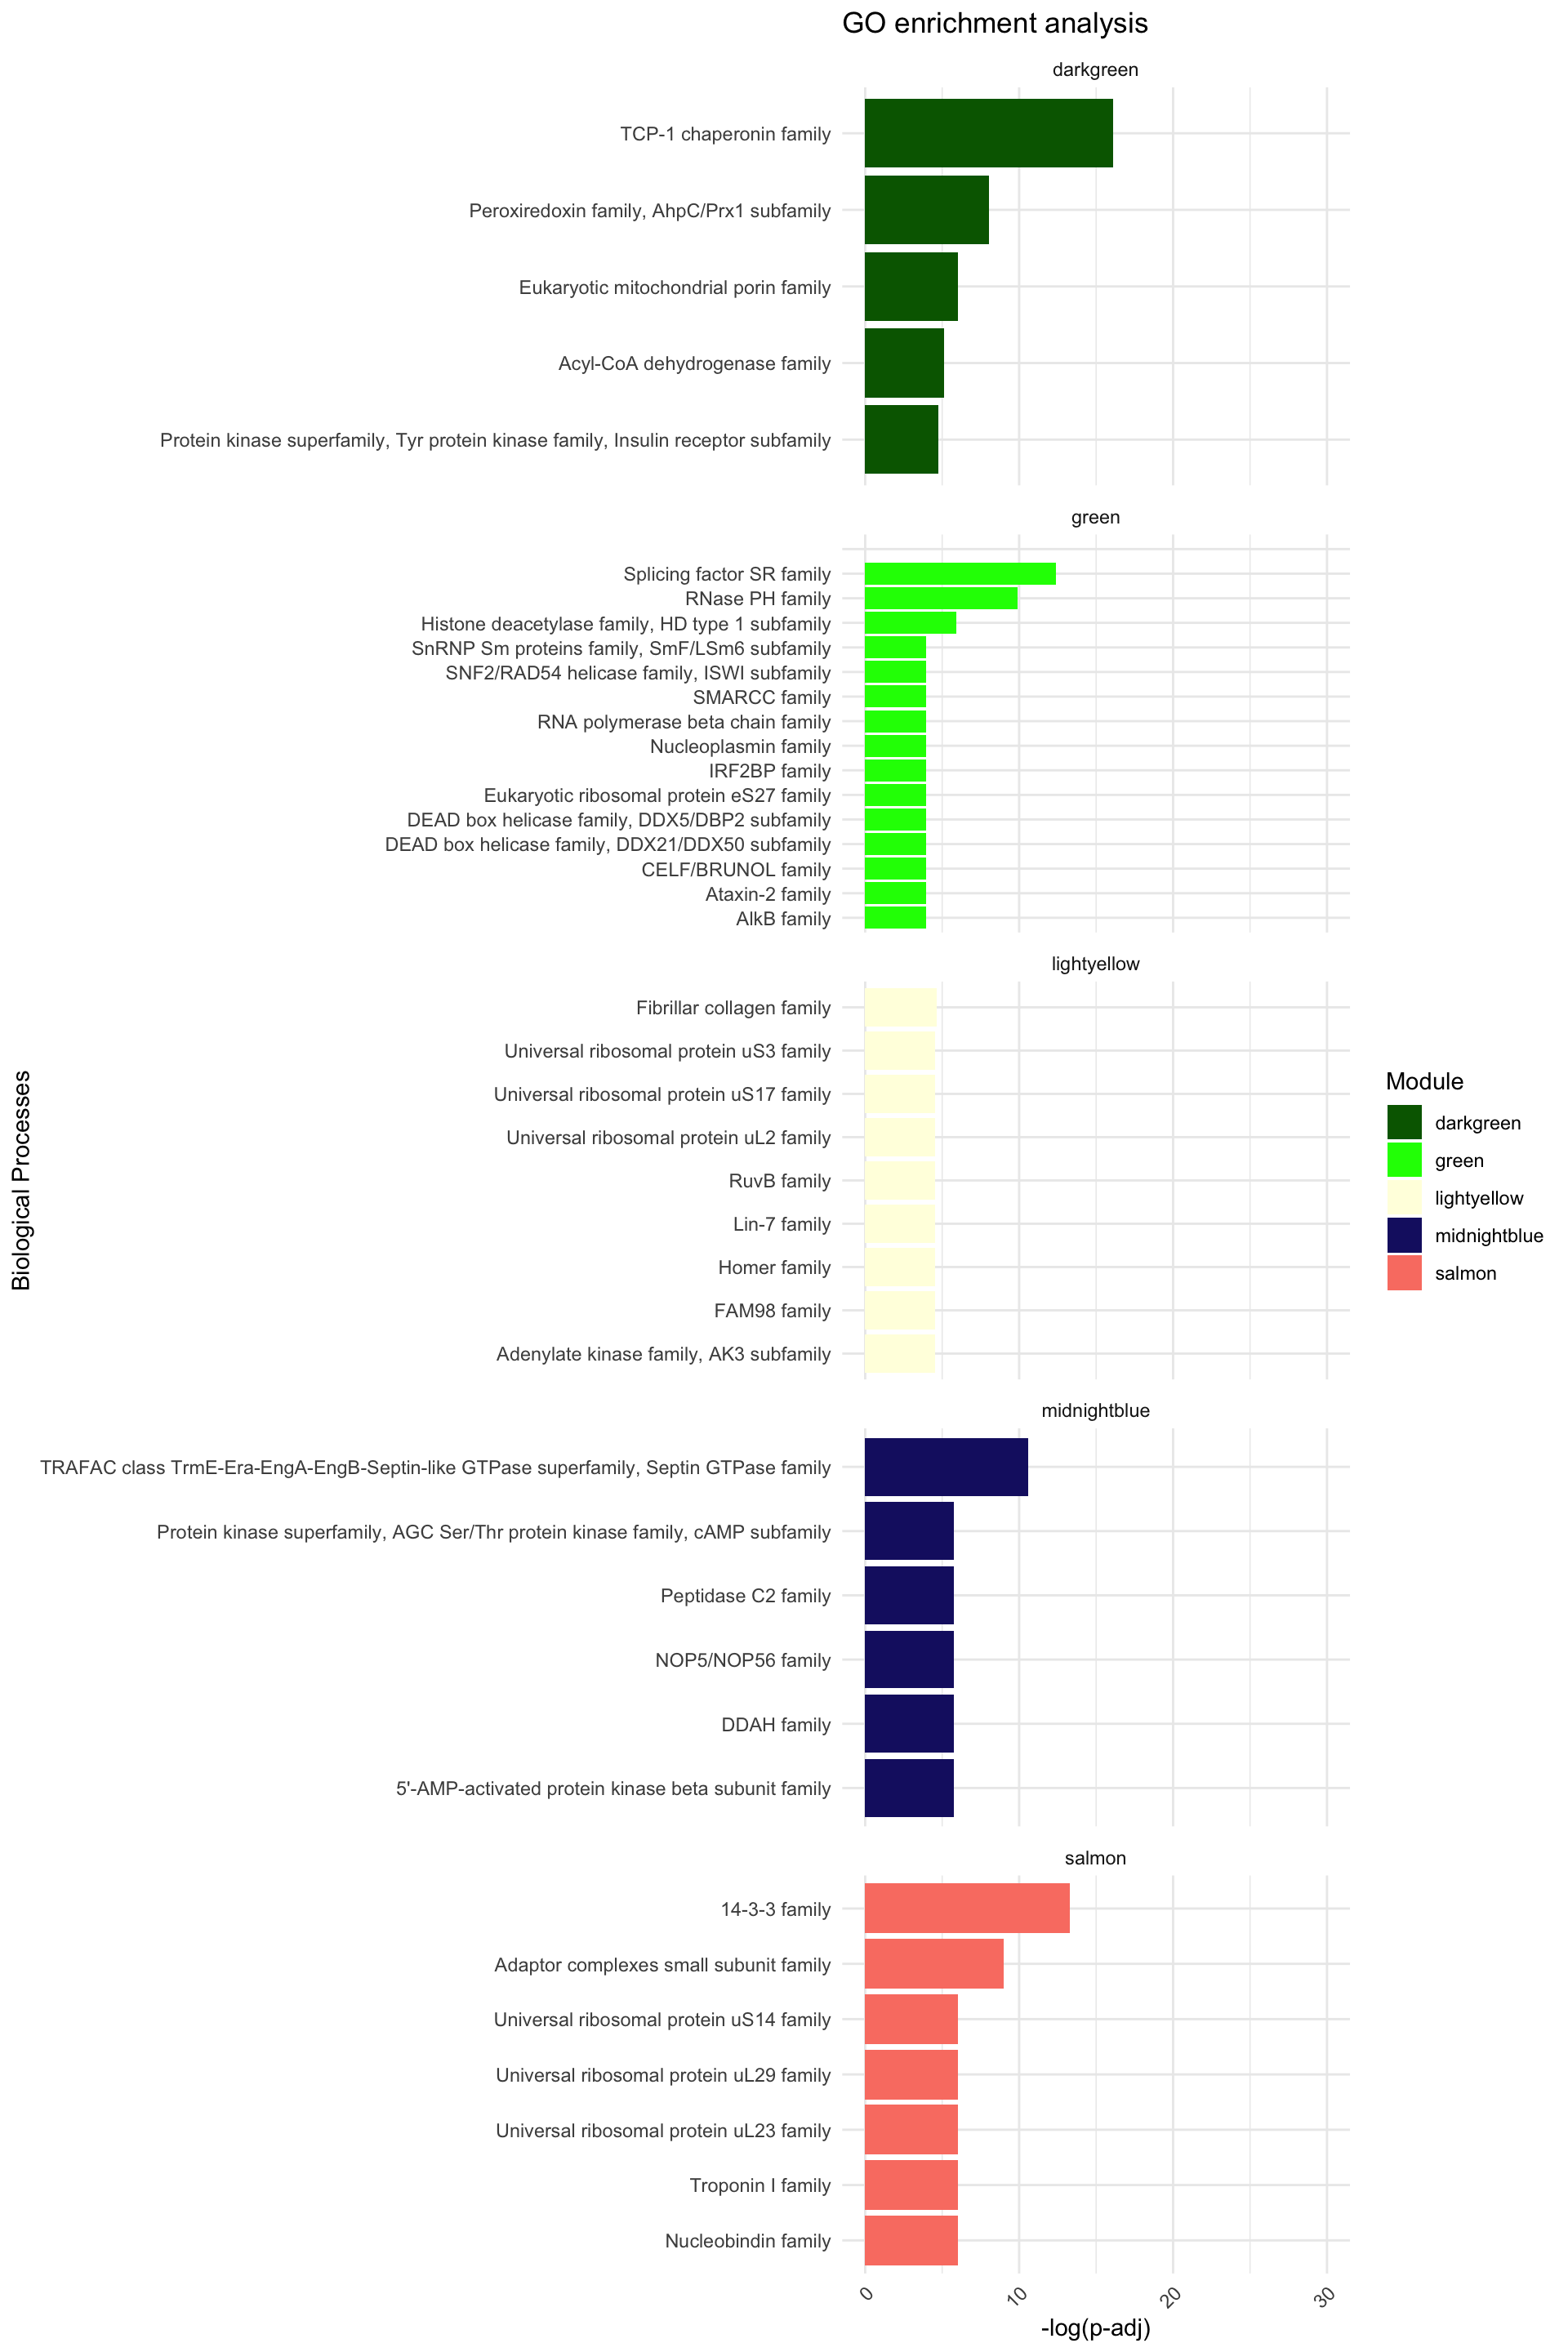
sessionInfo()R version 4.2.0 (2022-04-22)
Platform: x86_64-apple-darwin17.0 (64-bit)
Running under: macOS Big Sur/Monterey 10.16
Matrix products: default
BLAS: /Library/Frameworks/R.framework/Versions/4.2/Resources/lib/libRblas.0.dylib
LAPACK: /Library/Frameworks/R.framework/Versions/4.2/Resources/lib/libRlapack.dylib
locale:
[1] en_US.UTF-8/en_US.UTF-8/en_US.UTF-8/C/en_US.UTF-8/en_US.UTF-8
attached base packages:
[1] grid stats4 stats graphics grDevices utils datasets
[8] methods base
other attached packages:
[1] data.table_1.14.8
[2] scales_1.2.1
[3] ReactomePA_1.40.0
[4] impute_1.70.0
[5] WGCNA_1.72-1
[6] fastcluster_1.2.3
[7] dynamicTreeCut_1.63-1
[8] BioNERO_1.4.2
[9] reshape2_1.4.4
[10] ggridges_0.5.4
[11] biomaRt_2.52.0
[12] ggvenn_0.1.10
[13] UpSetR_1.4.0
[14] DOSE_3.22.1
[15] variancePartition_1.26.0
[16] clusterProfiler_4.4.4
[17] pheatmap_1.0.12
[18] qvalue_2.28.0
[19] Homo.sapiens_1.3.1
[20] TxDb.Hsapiens.UCSC.hg19.knownGene_3.2.2
[21] org.Hs.eg.db_3.15.0
[22] GO.db_3.15.0
[23] OrganismDbi_1.38.1
[24] GenomicFeatures_1.48.4
[25] AnnotationDbi_1.58.0
[26] cluster_2.1.4
[27] ggfortify_0.4.16
[28] lubridate_1.9.2
[29] forcats_1.0.0
[30] stringr_1.5.0
[31] dplyr_1.1.2
[32] purrr_1.0.2
[33] readr_2.1.4
[34] tidyr_1.3.0
[35] tibble_3.2.1
[36] ggplot2_3.4.3
[37] tidyverse_2.0.0
[38] RColorBrewer_1.1-3
[39] RUVSeq_1.30.0
[40] edgeR_3.38.4
[41] limma_3.52.4
[42] EDASeq_2.30.0
[43] ShortRead_1.54.0
[44] GenomicAlignments_1.32.1
[45] SummarizedExperiment_1.26.1
[46] MatrixGenerics_1.8.1
[47] matrixStats_1.0.0
[48] Rsamtools_2.12.0
[49] GenomicRanges_1.48.0
[50] Biostrings_2.64.1
[51] GenomeInfoDb_1.32.4
[52] XVector_0.36.0
[53] IRanges_2.30.1
[54] S4Vectors_0.34.0
[55] BiocParallel_1.30.4
[56] Biobase_2.56.0
[57] BiocGenerics_0.42.0
[58] workflowr_1.7.1
loaded via a namespace (and not attached):
[1] rappdirs_0.3.3 rtracklayer_1.56.1 minet_3.54.0
[4] R.methodsS3_1.8.2 coda_0.19-4 bit64_4.0.5
[7] knitr_1.43 aroma.light_3.26.0 DelayedArray_0.22.0
[10] R.utils_2.12.2 rpart_4.1.19 hwriter_1.3.2.1
[13] KEGGREST_1.36.3 RCurl_1.98-1.12 doParallel_1.0.17
[16] generics_0.1.3 preprocessCore_1.58.0 callr_3.7.3
[19] RhpcBLASctl_0.23-42 RSQLite_2.3.1 shadowtext_0.1.2
[22] bit_4.0.5 tzdb_0.4.0 enrichplot_1.16.2
[25] xml2_1.3.5 httpuv_1.6.11 viridis_0.6.4
[28] xfun_0.40 hms_1.1.3 jquerylib_0.1.4
[31] evaluate_0.21 promises_1.2.1 fansi_1.0.4
[34] restfulr_0.0.15 progress_1.2.2 caTools_1.18.2
[37] dbplyr_2.3.3 htmlwidgets_1.6.2 igraph_1.5.1
[40] DBI_1.1.3 ggnewscale_0.4.9 backports_1.4.1
[43] annotate_1.74.0 aod_1.3.2 deldir_1.0-9
[46] vctrs_0.6.3 abind_1.4-5 cachem_1.0.8
[49] withr_2.5.0 ggforce_0.4.1 checkmate_2.2.0
[52] treeio_1.20.2 prettyunits_1.1.1 ape_5.7-1
[55] lazyeval_0.2.2 crayon_1.5.2 genefilter_1.78.0
[58] labeling_0.4.2 pkgconfig_2.0.3 tweenr_2.0.2
[61] nlme_3.1-163 nnet_7.3-19 rlang_1.1.1
[64] lifecycle_1.0.3 downloader_0.4 filelock_1.0.2
[67] BiocFileCache_2.4.0 rprojroot_2.0.3 polyclip_1.10-4
[70] graph_1.74.0 Matrix_1.5-4.1 aplot_0.2.0
[73] NetRep_1.2.7 boot_1.3-28.1 base64enc_0.1-3
[76] GlobalOptions_0.1.2 whisker_0.4.1 processx_3.8.2
[79] png_0.1-8 viridisLite_0.4.2 rjson_0.2.21
[82] bitops_1.0-7 getPass_0.2-2 R.oo_1.25.0
[85] ggnetwork_0.5.12 KernSmooth_2.23-22 blob_1.2.4
[88] shape_1.4.6 jpeg_0.1-10 gridGraphics_0.5-1
[91] reactome.db_1.81.0 graphite_1.42.0 memoise_2.0.1
[94] magrittr_2.0.3 plyr_1.8.8 gplots_3.1.3
[97] zlibbioc_1.42.0 compiler_4.2.0 scatterpie_0.2.1
[100] BiocIO_1.6.0 clue_0.3-64 intergraph_2.0-3
[103] lme4_1.1-34 cli_3.6.1 patchwork_1.1.3
[106] ps_1.7.5 htmlTable_2.4.1 Formula_1.2-5
[109] mgcv_1.9-0 MASS_7.3-60 tidyselect_1.2.0
[112] stringi_1.7.12 highr_0.10 yaml_2.3.7
[115] GOSemSim_2.22.0 locfit_1.5-9.8 latticeExtra_0.6-30
[118] ggrepel_0.9.3 sass_0.4.7 fastmatch_1.1-4
[121] tools_4.2.0 timechange_0.2.0 parallel_4.2.0
[124] circlize_0.4.15 rstudioapi_0.15.0 foreign_0.8-84
[127] foreach_1.5.2 git2r_0.32.0 gridExtra_2.3
[130] farver_2.1.1 ggraph_2.1.0 digest_0.6.33
[133] BiocManager_1.30.22 networkD3_0.4 Rcpp_1.0.11
[136] broom_1.0.5 later_1.3.1 httr_1.4.7
[139] ComplexHeatmap_2.12.1 GENIE3_1.18.0 Rdpack_2.5
[142] colorspace_2.1-0 XML_3.99-0.14 fs_1.6.3
[145] splines_4.2.0 statmod_1.5.0 yulab.utils_0.0.8
[148] RBGL_1.72.0 tidytree_0.4.5 graphlayouts_1.0.0
[151] ggplotify_0.1.2 xtable_1.8-4 jsonlite_1.8.7
[154] nloptr_2.0.3 ggtree_3.4.4 tidygraph_1.2.3
[157] ggfun_0.1.2 R6_2.5.1 Hmisc_5.1-0
[160] pillar_1.9.0 htmltools_0.5.6 glue_1.6.2
[163] fastmap_1.1.1 minqa_1.2.5 codetools_0.2-19
[166] fgsea_1.22.0 utf8_1.2.3 sva_3.44.0
[169] lattice_0.21-8 bslib_0.5.1 network_1.18.1
[172] pbkrtest_0.5.2 curl_5.0.2 gtools_3.9.4
[175] interp_1.1-4 survival_3.5-7 statnet.common_4.9.0
[178] rmarkdown_2.24 munsell_0.5.0 GetoptLong_1.0.5
[181] DO.db_2.9 GenomeInfoDbData_1.2.8 iterators_1.0.14
[184] gtable_0.3.4 rbibutils_2.2.15